Immigrants from Iran vs Italian In Labor Force | Age 45-54
COMPARE
Immigrants from Iran
Italian
In Labor Force | Age 45-54
In Labor Force | Age 45-54 Comparison
Immigrants from Iran
Italians
83.1%
IN LABOR FORCE | AGE 45-54
87.2/ 100
METRIC RATING
125th/ 347
METRIC RANK
83.3%
IN LABOR FORCE | AGE 45-54
95.1/ 100
METRIC RATING
93rd/ 347
METRIC RANK
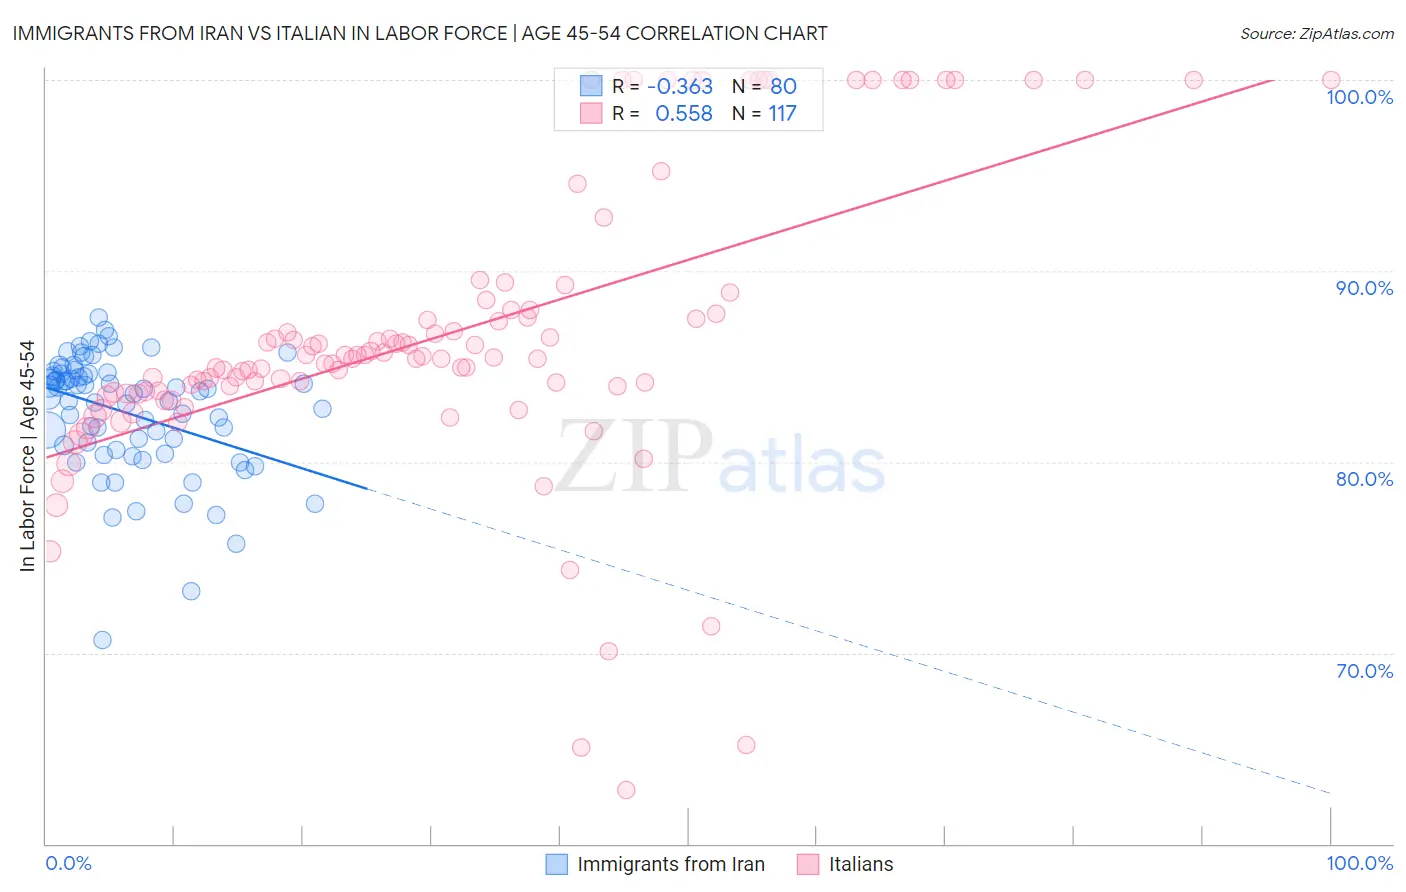
Immigrants from Iran vs Italian In Labor Force | Age 45-54 Correlation Chart
The statistical analysis conducted on geographies consisting of 279,820,433 people shows a mild negative correlation between the proportion of Immigrants from Iran and labor force participation rate among population between the ages 45 and 54 in the United States with a correlation coefficient (R) of -0.363 and weighted average of 83.1%. Similarly, the statistical analysis conducted on geographies consisting of 574,249,528 people shows a substantial positive correlation between the proportion of Italians and labor force participation rate among population between the ages 45 and 54 in the United States with a correlation coefficient (R) of 0.558 and weighted average of 83.3%, a difference of 0.23%.
In Labor Force | Age 45-54 Correlation Summary
| Measurement | Immigrants from Iran | Italian |
| Minimum | 70.7% | 62.8% |
| Maximum | 87.6% | 100.0% |
| Range | 16.9% | 37.2% |
| Mean | 82.6% | 86.7% |
| Median | 83.7% | 85.4% |
| Interquartile 25% (IQ1) | 80.8% | 83.6% |
| Interquartile 75% (IQ3) | 84.6% | 87.9% |
| Interquartile Range (IQR) | 3.9% | 4.3% |
| Standard Deviation (Sample) | 3.1% | 7.7% |
| Standard Deviation (Population) | 3.1% | 7.6% |
Similar Demographics by In Labor Force | Age 45-54
Demographics Similar to Immigrants from Iran by In Labor Force | Age 45-54
In terms of in labor force | age 45-54, the demographic groups most similar to Immigrants from Iran are Tongan (83.1%, a difference of 0.020%), Bermudan (83.1%, a difference of 0.020%), Immigrants from Belgium (83.1%, a difference of 0.020%), Immigrants from Vietnam (83.1%, a difference of 0.030%), and Uruguayan (83.1%, a difference of 0.040%).
| Demographics | Rating | Rank | In Labor Force | Age 45-54 |
| Immigrants | Europe | 90.7 /100 | #118 | Exceptional 83.2% |
| Immigrants | Uruguay | 90.2 /100 | #119 | Exceptional 83.2% |
| Immigrants | Russia | 90.1 /100 | #120 | Exceptional 83.2% |
| Uruguayans | 89.4 /100 | #121 | Excellent 83.1% |
| Immigrants | Vietnam | 88.9 /100 | #122 | Excellent 83.1% |
| Tongans | 88.2 /100 | #123 | Excellent 83.1% |
| Bermudans | 88.0 /100 | #124 | Excellent 83.1% |
| Immigrants | Iran | 87.2 /100 | #125 | Excellent 83.1% |
| Immigrants | Belgium | 86.4 /100 | #126 | Excellent 83.1% |
| Immigrants | Jordan | 85.2 /100 | #127 | Excellent 83.1% |
| Germans | 85.1 /100 | #128 | Excellent 83.1% |
| Immigrants | Northern Europe | 85.1 /100 | #129 | Excellent 83.1% |
| Immigrants | Israel | 84.7 /100 | #130 | Excellent 83.1% |
| Finns | 83.3 /100 | #131 | Excellent 83.1% |
| Immigrants | Ukraine | 82.9 /100 | #132 | Excellent 83.0% |
Demographics Similar to Italians by In Labor Force | Age 45-54
In terms of in labor force | age 45-54, the demographic groups most similar to Italians are Danish (83.3%, a difference of 0.010%), Argentinean (83.3%, a difference of 0.010%), Immigrants from Argentina (83.3%, a difference of 0.010%), Immigrants from Eastern Europe (83.3%, a difference of 0.020%), and Immigrants from Asia (83.3%, a difference of 0.020%).
| Demographics | Rating | Rank | In Labor Force | Age 45-54 |
| Immigrants | Northern Africa | 95.7 /100 | #86 | Exceptional 83.3% |
| Immigrants | Eastern Europe | 95.6 /100 | #87 | Exceptional 83.3% |
| Immigrants | Asia | 95.6 /100 | #88 | Exceptional 83.3% |
| Indians (Asian) | 95.5 /100 | #89 | Exceptional 83.3% |
| Immigrants | Japan | 95.5 /100 | #90 | Exceptional 83.3% |
| South Americans | 95.5 /100 | #91 | Exceptional 83.3% |
| Danes | 95.3 /100 | #92 | Exceptional 83.3% |
| Italians | 95.1 /100 | #93 | Exceptional 83.3% |
| Argentineans | 94.9 /100 | #94 | Exceptional 83.3% |
| Immigrants | Argentina | 94.9 /100 | #95 | Exceptional 83.3% |
| Immigrants | Kuwait | 94.8 /100 | #96 | Exceptional 83.3% |
| Palestinians | 94.8 /100 | #97 | Exceptional 83.3% |
| Maltese | 94.4 /100 | #98 | Exceptional 83.3% |
| Immigrants | Middle Africa | 94.3 /100 | #99 | Exceptional 83.3% |
| Mongolians | 94.2 /100 | #100 | Exceptional 83.3% |