Immigrants from Indonesia vs Nepalese In Labor Force | Age 16-19
COMPARE
Immigrants from Indonesia
Nepalese
In Labor Force | Age 16-19
In Labor Force | Age 16-19 Comparison
Immigrants from Indonesia
Nepalese
33.5%
IN LABOR FORCE | AGE 16-19
0.1/ 100
METRIC RATING
288th/ 347
METRIC RANK
33.5%
IN LABOR FORCE | AGE 16-19
0.1/ 100
METRIC RATING
287th/ 347
METRIC RANK
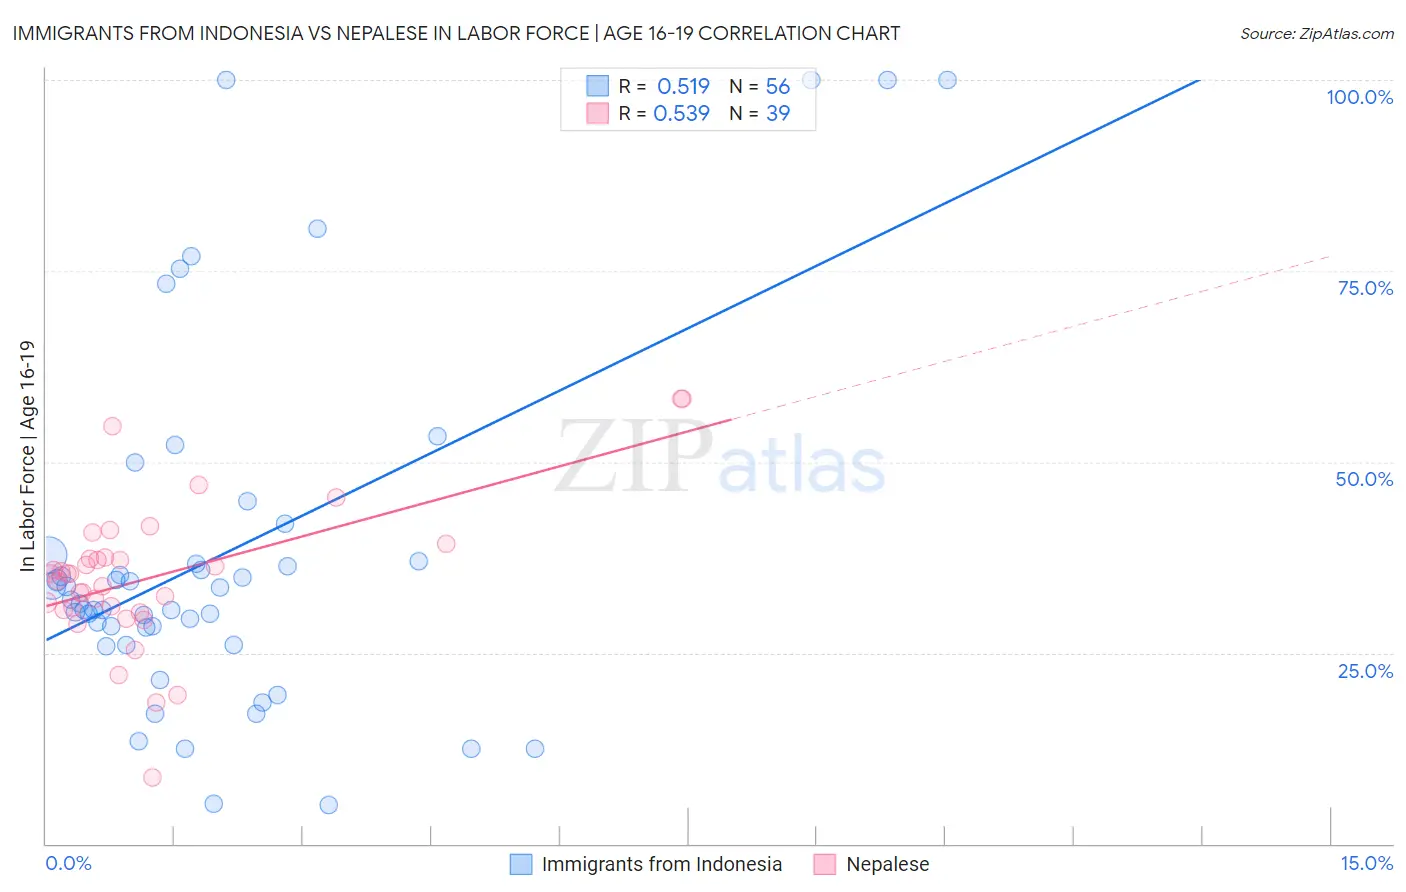
Immigrants from Indonesia vs Nepalese In Labor Force | Age 16-19 Correlation Chart
The statistical analysis conducted on geographies consisting of 215,635,356 people shows a substantial positive correlation between the proportion of Immigrants from Indonesia and labor force participation rate among population between the ages 16 and 19 in the United States with a correlation coefficient (R) of 0.519 and weighted average of 33.5%. Similarly, the statistical analysis conducted on geographies consisting of 24,520,458 people shows a substantial positive correlation between the proportion of Nepalese and labor force participation rate among population between the ages 16 and 19 in the United States with a correlation coefficient (R) of 0.539 and weighted average of 33.5%, a difference of 0.040%.
In Labor Force | Age 16-19 Correlation Summary
| Measurement | Immigrants from Indonesia | Nepalese |
| Minimum | 5.1% | 8.7% |
| Maximum | 100.0% | 58.3% |
| Range | 94.9% | 49.6% |
| Mean | 37.9% | 34.9% |
| Median | 31.7% | 35.3% |
| Interquartile 25% (IQ1) | 27.2% | 30.6% |
| Interquartile 75% (IQ3) | 37.4% | 37.4% |
| Interquartile Range (IQR) | 10.2% | 6.8% |
| Standard Deviation (Sample) | 23.4% | 9.7% |
| Standard Deviation (Population) | 23.2% | 9.5% |
Demographics Similar to Immigrants from Indonesia and Nepalese by In Labor Force | Age 16-19
In terms of in labor force | age 16-19, the demographic groups most similar to Immigrants from Indonesia are Immigrants from Singapore (33.5%, a difference of 0.0%), Immigrants from Colombia (33.5%, a difference of 0.14%), Immigrants from Belarus (33.4%, a difference of 0.22%), South American (33.6%, a difference of 0.27%), and Haitian (33.4%, a difference of 0.28%). Similarly, the demographic groups most similar to Nepalese are Immigrants from Singapore (33.5%, a difference of 0.040%), Immigrants from Colombia (33.5%, a difference of 0.18%), South American (33.6%, a difference of 0.23%), Immigrants from Belarus (33.4%, a difference of 0.25%), and U.S. Virgin Islander (33.6%, a difference of 0.31%).
| Demographics | Rating | Rank | In Labor Force | Age 16-19 |
| Menominee | 0.3 /100 | #277 | Tragic 33.9% |
| Colombians | 0.3 /100 | #278 | Tragic 33.8% |
| Paraguayans | 0.3 /100 | #279 | Tragic 33.8% |
| Taiwanese | 0.3 /100 | #280 | Tragic 33.8% |
| Cypriots | 0.3 /100 | #281 | Tragic 33.8% |
| Immigrants | Korea | 0.3 /100 | #282 | Tragic 33.8% |
| Immigrants | Venezuela | 0.2 /100 | #283 | Tragic 33.7% |
| Immigrants | Spain | 0.2 /100 | #284 | Tragic 33.7% |
| U.S. Virgin Islanders | 0.2 /100 | #285 | Tragic 33.6% |
| South Americans | 0.2 /100 | #286 | Tragic 33.6% |
| Nepalese | 0.1 /100 | #287 | Tragic 33.5% |
| Immigrants | Indonesia | 0.1 /100 | #288 | Tragic 33.5% |
| Immigrants | Singapore | 0.1 /100 | #289 | Tragic 33.5% |
| Immigrants | Colombia | 0.1 /100 | #290 | Tragic 33.5% |
| Immigrants | Belarus | 0.1 /100 | #291 | Tragic 33.4% |
| Haitians | 0.1 /100 | #292 | Tragic 33.4% |
| Immigrants | South America | 0.1 /100 | #293 | Tragic 33.3% |
| Argentineans | 0.1 /100 | #294 | Tragic 33.3% |
| Yup'ik | 0.1 /100 | #295 | Tragic 33.3% |
| Jamaicans | 0.1 /100 | #296 | Tragic 33.2% |
| Immigrants | Haiti | 0.1 /100 | #297 | Tragic 33.2% |