Ugandan vs Turkish In Labor Force | Age 20-24
COMPARE
Ugandan
Turkish
In Labor Force | Age 20-24
In Labor Force | Age 20-24 Comparison
Ugandans
Turks
75.4%
IN LABOR FORCE | AGE 20-24
76.1/ 100
METRIC RATING
149th/ 347
METRIC RANK
73.9%
IN LABOR FORCE | AGE 20-24
1.8/ 100
METRIC RATING
245th/ 347
METRIC RANK
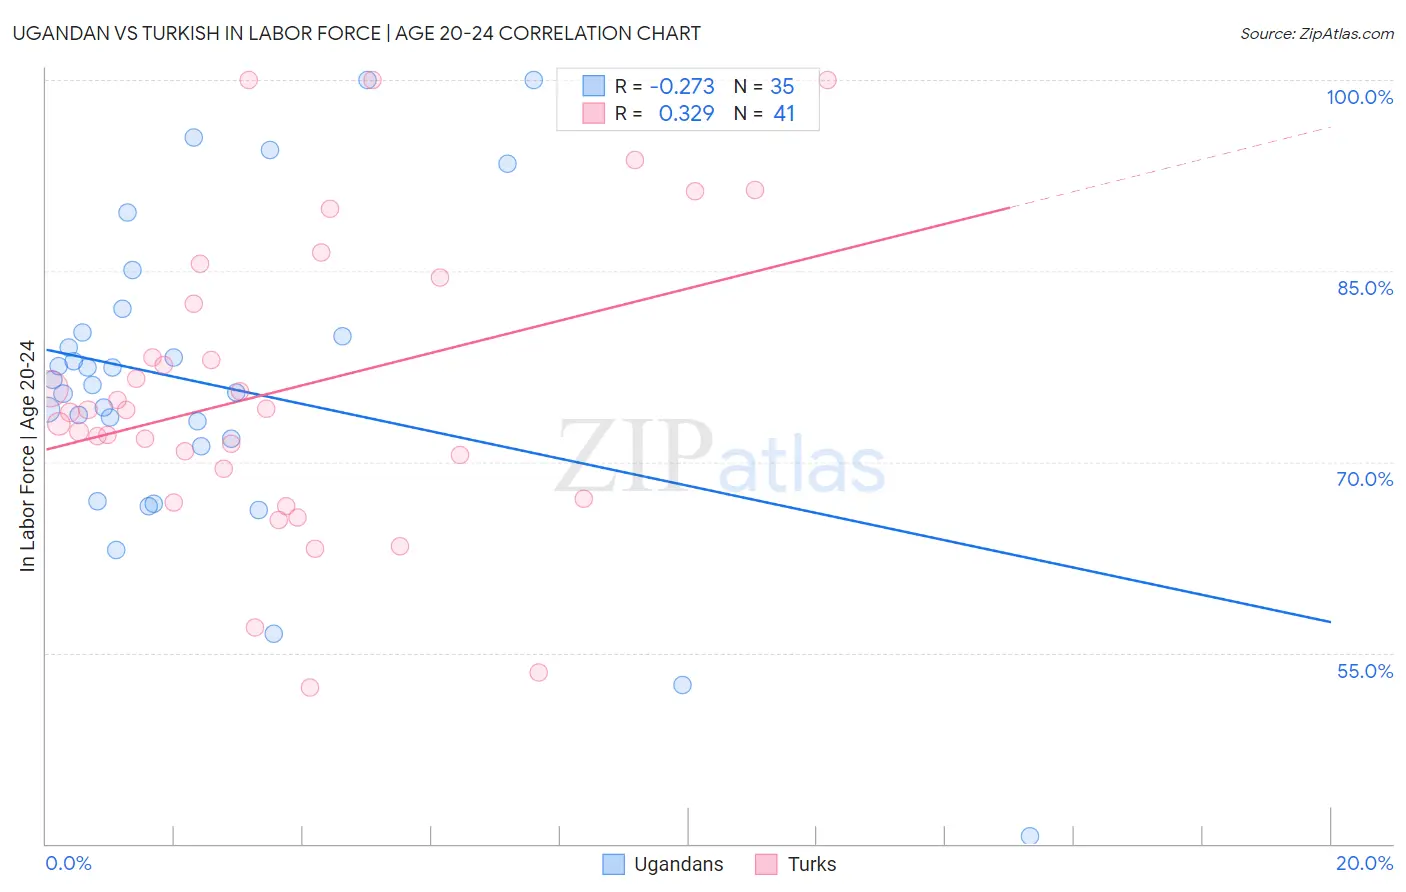
Ugandan vs Turkish In Labor Force | Age 20-24 Correlation Chart
The statistical analysis conducted on geographies consisting of 94,014,885 people shows a weak negative correlation between the proportion of Ugandans and labor force participation rate among population between the ages 20 and 24 in the United States with a correlation coefficient (R) of -0.273 and weighted average of 75.4%. Similarly, the statistical analysis conducted on geographies consisting of 271,784,032 people shows a mild positive correlation between the proportion of Turks and labor force participation rate among population between the ages 20 and 24 in the United States with a correlation coefficient (R) of 0.329 and weighted average of 73.9%, a difference of 1.9%.
In Labor Force | Age 20-24 Correlation Summary
| Measurement | Ugandan | Turkish |
| Minimum | 40.6% | 52.3% |
| Maximum | 100.0% | 100.0% |
| Range | 59.4% | 47.7% |
| Mean | 76.1% | 75.7% |
| Median | 76.0% | 74.1% |
| Interquartile 25% (IQ1) | 71.2% | 68.3% |
| Interquartile 75% (IQ3) | 80.2% | 83.5% |
| Interquartile Range (IQR) | 8.9% | 15.2% |
| Standard Deviation (Sample) | 12.5% | 11.7% |
| Standard Deviation (Population) | 12.3% | 11.5% |
Similar Demographics by In Labor Force | Age 20-24
Demographics Similar to Ugandans by In Labor Force | Age 20-24
In terms of in labor force | age 20-24, the demographic groups most similar to Ugandans are Immigrants from Cambodia (75.4%, a difference of 0.010%), Salvadoran (75.3%, a difference of 0.020%), Comanche (75.4%, a difference of 0.030%), Paiute (75.3%, a difference of 0.040%), and Lebanese (75.3%, a difference of 0.050%).
| Demographics | Rating | Rank | In Labor Force | Age 20-24 |
| Blackfeet | 83.6 /100 | #142 | Excellent 75.5% |
| Spaniards | 82.0 /100 | #143 | Excellent 75.5% |
| Bhutanese | 80.8 /100 | #144 | Excellent 75.4% |
| Koreans | 79.7 /100 | #145 | Good 75.4% |
| Mexican American Indians | 78.8 /100 | #146 | Good 75.4% |
| Comanche | 77.6 /100 | #147 | Good 75.4% |
| Immigrants | Cambodia | 76.7 /100 | #148 | Good 75.4% |
| Ugandans | 76.1 /100 | #149 | Good 75.4% |
| Salvadorans | 74.8 /100 | #150 | Good 75.3% |
| Paiute | 74.1 /100 | #151 | Good 75.3% |
| Lebanese | 73.5 /100 | #152 | Good 75.3% |
| Guatemalans | 72.3 /100 | #153 | Good 75.3% |
| Osage | 72.3 /100 | #154 | Good 75.3% |
| Immigrants | Guatemala | 71.9 /100 | #155 | Good 75.3% |
| Immigrants | El Salvador | 71.7 /100 | #156 | Good 75.3% |
Demographics Similar to Turks by In Labor Force | Age 20-24
In terms of in labor force | age 20-24, the demographic groups most similar to Turks are Immigrants from Syria (74.0%, a difference of 0.030%), Immigrants from South Central Asia (74.0%, a difference of 0.030%), Immigrants from Panama (73.9%, a difference of 0.040%), Thai (74.0%, a difference of 0.060%), and Immigrants from Senegal (74.0%, a difference of 0.070%).
| Demographics | Rating | Rank | In Labor Force | Age 20-24 |
| Immigrants | Japan | 3.0 /100 | #238 | Tragic 74.1% |
| Immigrants | Latin America | 2.7 /100 | #239 | Tragic 74.1% |
| Immigrants | Sri Lanka | 2.3 /100 | #240 | Tragic 74.0% |
| Immigrants | Senegal | 2.1 /100 | #241 | Tragic 74.0% |
| Thais | 2.1 /100 | #242 | Tragic 74.0% |
| Immigrants | Syria | 1.9 /100 | #243 | Tragic 74.0% |
| Immigrants | South Central Asia | 1.9 /100 | #244 | Tragic 74.0% |
| Turks | 1.8 /100 | #245 | Tragic 73.9% |
| Immigrants | Panama | 1.6 /100 | #246 | Tragic 73.9% |
| Colville | 1.5 /100 | #247 | Tragic 73.9% |
| Immigrants | Saudi Arabia | 1.5 /100 | #248 | Tragic 73.9% |
| Blacks/African Americans | 1.3 /100 | #249 | Tragic 73.9% |
| Immigrants | Belgium | 1.3 /100 | #250 | Tragic 73.9% |
| Immigrants | Egypt | 1.2 /100 | #251 | Tragic 73.8% |
| Immigrants | Kazakhstan | 1.1 /100 | #252 | Tragic 73.8% |