Immigrants from Peru vs British In Labor Force | Age 20-64
COMPARE
Immigrants from Peru
British
In Labor Force | Age 20-64
In Labor Force | Age 20-64 Comparison
Immigrants from Peru
British
80.3%
IN LABOR FORCE | AGE 20-64
99.2/ 100
METRIC RATING
53rd/ 347
METRIC RANK
79.3%
IN LABOR FORCE | AGE 20-64
16.5/ 100
METRIC RATING
208th/ 347
METRIC RANK
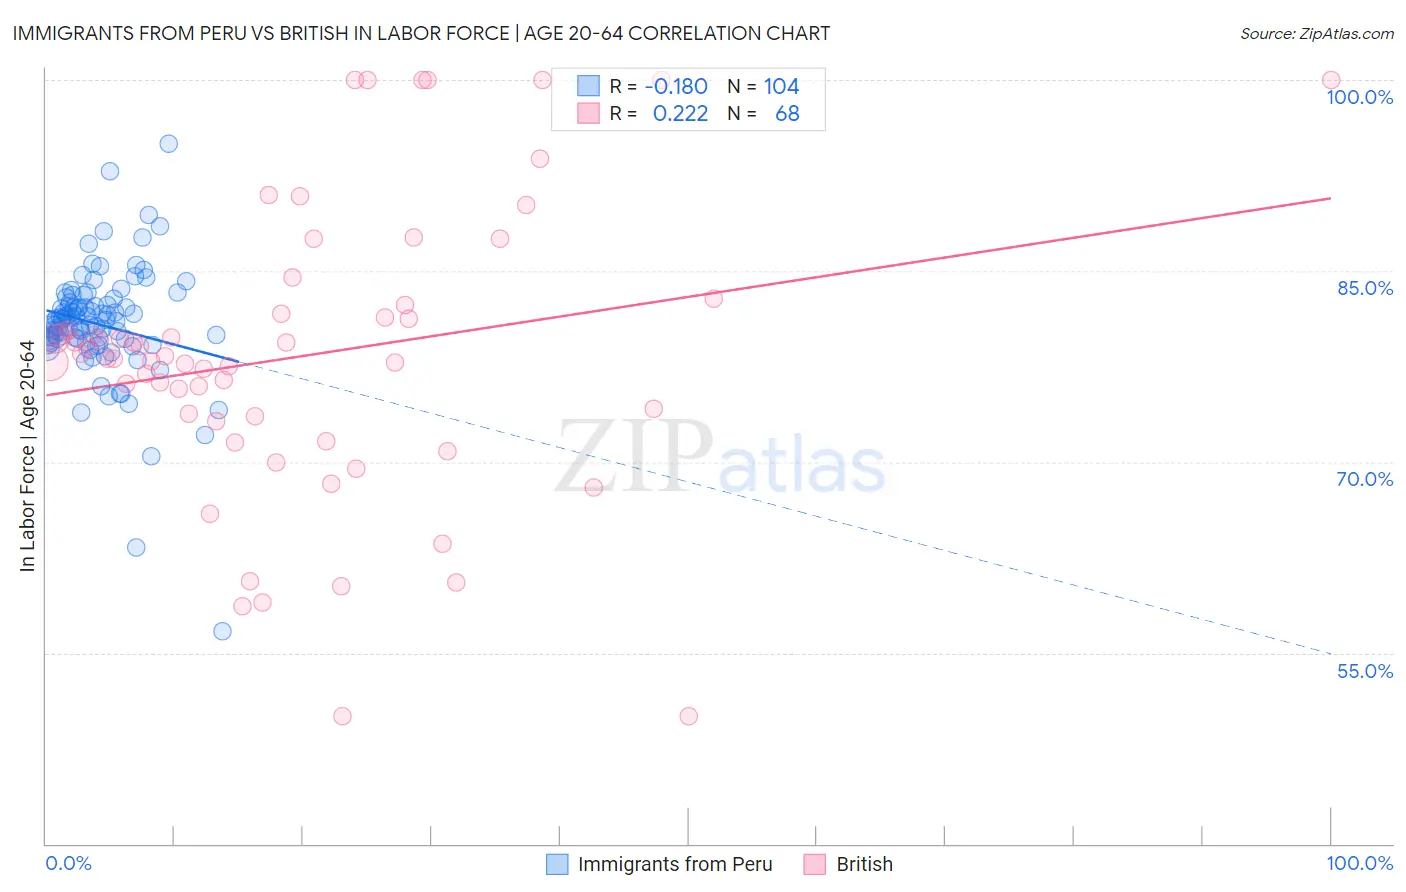
Immigrants from Peru vs British In Labor Force | Age 20-64 Correlation Chart
The statistical analysis conducted on geographies consisting of 328,856,487 people shows a poor negative correlation between the proportion of Immigrants from Peru and labor force participation rate among population between the ages 20 and 64 in the United States with a correlation coefficient (R) of -0.180 and weighted average of 80.3%. Similarly, the statistical analysis conducted on geographies consisting of 531,500,819 people shows a weak positive correlation between the proportion of British and labor force participation rate among population between the ages 20 and 64 in the United States with a correlation coefficient (R) of 0.222 and weighted average of 79.3%, a difference of 1.3%.
In Labor Force | Age 20-64 Correlation Summary
| Measurement | Immigrants from Peru | British |
| Minimum | 56.7% | 50.0% |
| Maximum | 95.0% | 100.0% |
| Range | 38.3% | 50.0% |
| Mean | 80.8% | 78.3% |
| Median | 81.0% | 78.2% |
| Interquartile 25% (IQ1) | 79.5% | 73.4% |
| Interquartile 75% (IQ3) | 82.4% | 81.9% |
| Interquartile Range (IQR) | 2.9% | 8.6% |
| Standard Deviation (Sample) | 4.7% | 11.4% |
| Standard Deviation (Population) | 4.7% | 11.3% |
Similar Demographics by In Labor Force | Age 20-64
Demographics Similar to Immigrants from Peru by In Labor Force | Age 20-64
In terms of in labor force | age 20-64, the demographic groups most similar to Immigrants from Peru are Peruvian (80.3%, a difference of 0.010%), Turkish (80.3%, a difference of 0.020%), Immigrants from Sri Lanka (80.4%, a difference of 0.030%), Immigrants from Cabo Verde (80.3%, a difference of 0.040%), and Immigrants from Northern Africa (80.3%, a difference of 0.050%).
| Demographics | Rating | Rank | In Labor Force | Age 20-64 |
| Immigrants | Pakistan | 99.6 /100 | #46 | Exceptional 80.5% |
| Immigrants | Africa | 99.6 /100 | #47 | Exceptional 80.4% |
| Immigrants | Hong Kong | 99.5 /100 | #48 | Exceptional 80.4% |
| Immigrants | Greece | 99.4 /100 | #49 | Exceptional 80.4% |
| Immigrants | Sudan | 99.4 /100 | #50 | Exceptional 80.4% |
| Immigrants | Sri Lanka | 99.3 /100 | #51 | Exceptional 80.4% |
| Turks | 99.2 /100 | #52 | Exceptional 80.3% |
| Immigrants | Peru | 99.2 /100 | #53 | Exceptional 80.3% |
| Peruvians | 99.1 /100 | #54 | Exceptional 80.3% |
| Immigrants | Cabo Verde | 99.0 /100 | #55 | Exceptional 80.3% |
| Immigrants | Northern Africa | 99.0 /100 | #56 | Exceptional 80.3% |
| Afghans | 98.9 /100 | #57 | Exceptional 80.3% |
| Serbians | 98.9 /100 | #58 | Exceptional 80.3% |
| Swedes | 98.9 /100 | #59 | Exceptional 80.3% |
| Tongans | 98.8 /100 | #60 | Exceptional 80.3% |
Demographics Similar to British by In Labor Force | Age 20-64
In terms of in labor force | age 20-64, the demographic groups most similar to British are Subsaharan African (79.3%, a difference of 0.0%), Bangladeshi (79.3%, a difference of 0.0%), Immigrants from Ecuador (79.3%, a difference of 0.010%), Haitian (79.3%, a difference of 0.010%), and Iraqi (79.3%, a difference of 0.020%).
| Demographics | Rating | Rank | In Labor Force | Age 20-64 |
| Immigrants | Nicaragua | 19.0 /100 | #201 | Poor 79.3% |
| Nicaraguans | 18.3 /100 | #202 | Poor 79.3% |
| Iraqis | 17.7 /100 | #203 | Poor 79.3% |
| Immigrants | Cambodia | 17.6 /100 | #204 | Poor 79.3% |
| Immigrants | Congo | 17.5 /100 | #205 | Poor 79.3% |
| Immigrants | Ecuador | 16.9 /100 | #206 | Poor 79.3% |
| Sub-Saharan Africans | 16.5 /100 | #207 | Poor 79.3% |
| British | 16.5 /100 | #208 | Poor 79.3% |
| Bangladeshis | 16.4 /100 | #209 | Poor 79.3% |
| Haitians | 16.1 /100 | #210 | Poor 79.3% |
| Europeans | 15.3 /100 | #211 | Poor 79.3% |
| Irish | 13.2 /100 | #212 | Poor 79.3% |
| Immigrants | Portugal | 12.8 /100 | #213 | Poor 79.3% |
| Immigrants | Armenia | 12.2 /100 | #214 | Poor 79.2% |
| Immigrants | Norway | 12.0 /100 | #215 | Poor 79.2% |