Immigrants from Hong Kong vs Pueblo 2nd Grade
COMPARE
Immigrants from Hong Kong
Pueblo
2nd Grade
2nd Grade Comparison
Immigrants from Hong Kong
Pueblo
97.2%
2ND GRADE
0.0/ 100
METRIC RATING
285th/ 347
METRIC RANK
98.3%
2ND GRADE
99.8/ 100
METRIC RATING
53rd/ 347
METRIC RANK
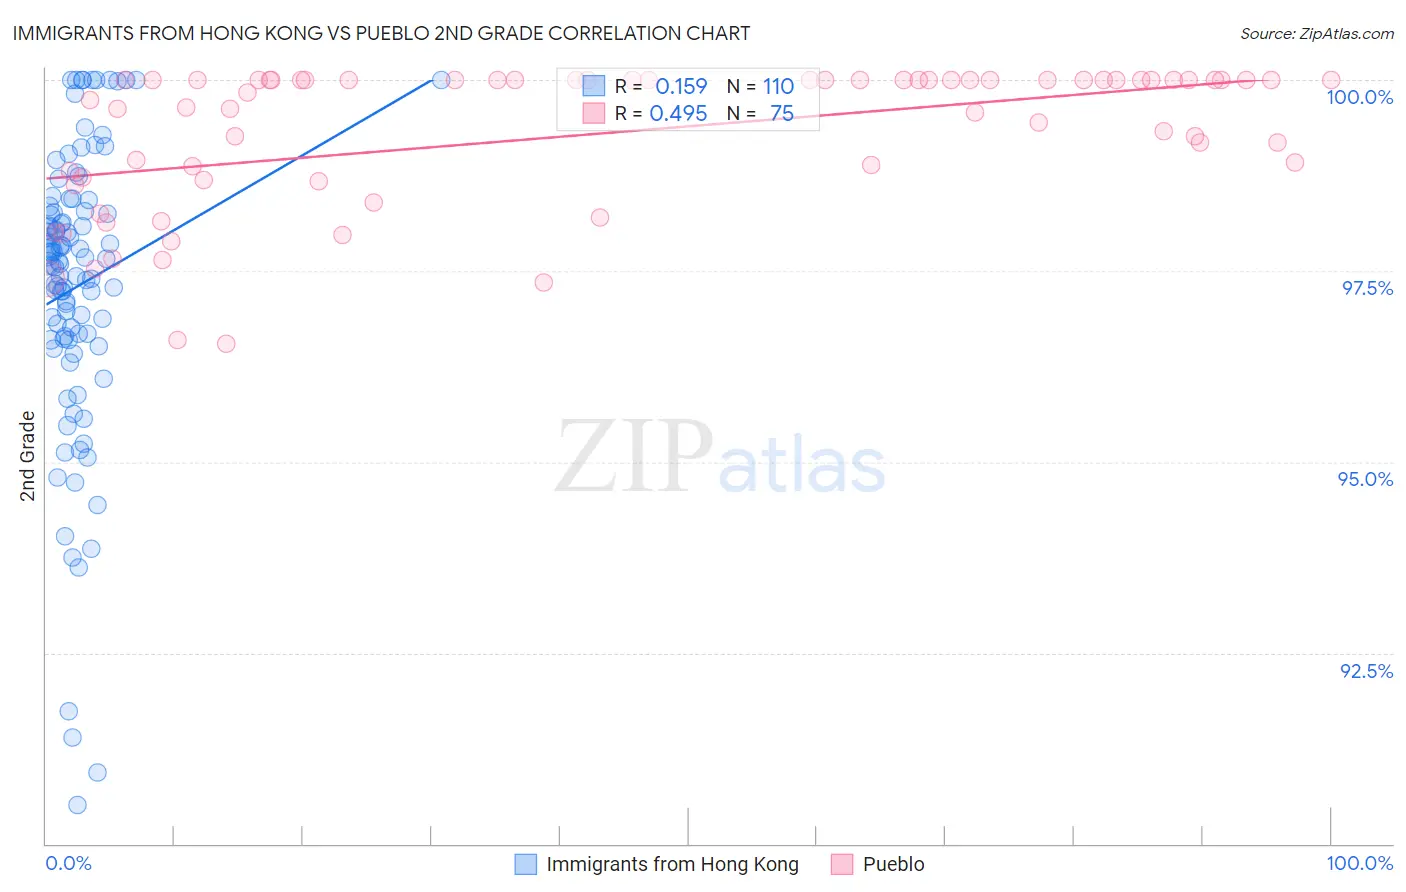
Immigrants from Hong Kong vs Pueblo 2nd Grade Correlation Chart
The statistical analysis conducted on geographies consisting of 253,948,669 people shows a poor positive correlation between the proportion of Immigrants from Hong Kong and percentage of population with at least 2nd grade education in the United States with a correlation coefficient (R) of 0.159 and weighted average of 97.2%. Similarly, the statistical analysis conducted on geographies consisting of 120,087,340 people shows a moderate positive correlation between the proportion of Pueblo and percentage of population with at least 2nd grade education in the United States with a correlation coefficient (R) of 0.495 and weighted average of 98.3%, a difference of 1.2%.
2nd Grade Correlation Summary
| Measurement | Immigrants from Hong Kong | Pueblo |
| Minimum | 90.5% | 96.5% |
| Maximum | 100.0% | 100.0% |
| Range | 9.5% | 3.5% |
| Mean | 97.3% | 99.3% |
| Median | 97.6% | 100.0% |
| Interquartile 25% (IQ1) | 96.6% | 98.7% |
| Interquartile 75% (IQ3) | 98.3% | 100.0% |
| Interquartile Range (IQR) | 1.7% | 1.3% |
| Standard Deviation (Sample) | 1.9% | 0.94% |
| Standard Deviation (Population) | 1.9% | 0.94% |
Similar Demographics by 2nd Grade
Demographics Similar to Immigrants from Hong Kong by 2nd Grade
In terms of 2nd grade, the demographic groups most similar to Immigrants from Hong Kong are Immigrants from Barbados (97.2%, a difference of 0.0%), Immigrants from Portugal (97.2%, a difference of 0.0%), Immigrants from West Indies (97.2%, a difference of 0.010%), Immigrants from Thailand (97.2%, a difference of 0.010%), and Immigrants from Trinidad and Tobago (97.2%, a difference of 0.020%).
| Demographics | Rating | Rank | 2nd Grade |
| Immigrants | Uzbekistan | 0.1 /100 | #278 | Tragic 97.3% |
| Immigrants | Ghana | 0.1 /100 | #279 | Tragic 97.3% |
| Afghans | 0.1 /100 | #280 | Tragic 97.3% |
| Trinidadians and Tobagonians | 0.1 /100 | #281 | Tragic 97.3% |
| Barbadians | 0.1 /100 | #282 | Tragic 97.3% |
| Immigrants | Trinidad and Tobago | 0.0 /100 | #283 | Tragic 97.2% |
| Immigrants | West Indies | 0.0 /100 | #284 | Tragic 97.2% |
| Immigrants | Hong Kong | 0.0 /100 | #285 | Tragic 97.2% |
| Immigrants | Barbados | 0.0 /100 | #286 | Tragic 97.2% |
| Immigrants | Portugal | 0.0 /100 | #287 | Tragic 97.2% |
| Immigrants | Thailand | 0.0 /100 | #288 | Tragic 97.2% |
| Houma | 0.0 /100 | #289 | Tragic 97.2% |
| Immigrants | St. Vincent and the Grenadines | 0.0 /100 | #290 | Tragic 97.2% |
| Immigrants | Afghanistan | 0.0 /100 | #291 | Tragic 97.2% |
| Immigrants | Eritrea | 0.0 /100 | #292 | Tragic 97.2% |
Demographics Similar to Pueblo by 2nd Grade
In terms of 2nd grade, the demographic groups most similar to Pueblo are Kiowa (98.3%, a difference of 0.0%), Immigrants from Scotland (98.3%, a difference of 0.0%), Celtic (98.4%, a difference of 0.010%), White/Caucasian (98.4%, a difference of 0.010%), and Estonian (98.4%, a difference of 0.010%).
| Demographics | Rating | Rank | 2nd Grade |
| Lumbee | 99.9 /100 | #46 | Exceptional 98.4% |
| Ottawa | 99.9 /100 | #47 | Exceptional 98.4% |
| Czechoslovakians | 99.9 /100 | #48 | Exceptional 98.4% |
| Celtics | 99.8 /100 | #49 | Exceptional 98.4% |
| Whites/Caucasians | 99.8 /100 | #50 | Exceptional 98.4% |
| Estonians | 99.8 /100 | #51 | Exceptional 98.4% |
| Australians | 99.8 /100 | #52 | Exceptional 98.4% |
| Pueblo | 99.8 /100 | #53 | Exceptional 98.3% |
| Kiowa | 99.8 /100 | #54 | Exceptional 98.3% |
| Immigrants | Scotland | 99.8 /100 | #55 | Exceptional 98.3% |
| Americans | 99.8 /100 | #56 | Exceptional 98.3% |
| Austrians | 99.8 /100 | #57 | Exceptional 98.3% |
| Bulgarians | 99.8 /100 | #58 | Exceptional 98.3% |
| Slavs | 99.8 /100 | #59 | Exceptional 98.3% |
| Creek | 99.8 /100 | #60 | Exceptional 98.3% |