French vs Tsimshian In Labor Force | Age 30-34
COMPARE
French
Tsimshian
In Labor Force | Age 30-34
In Labor Force | Age 30-34 Comparison
French
Tsimshian
84.4%
IN LABOR FORCE | AGE 30-34
13.8/ 100
METRIC RATING
205th/ 347
METRIC RANK
85.8%
IN LABOR FORCE | AGE 30-34
100.0/ 100
METRIC RATING
29th/ 347
METRIC RANK
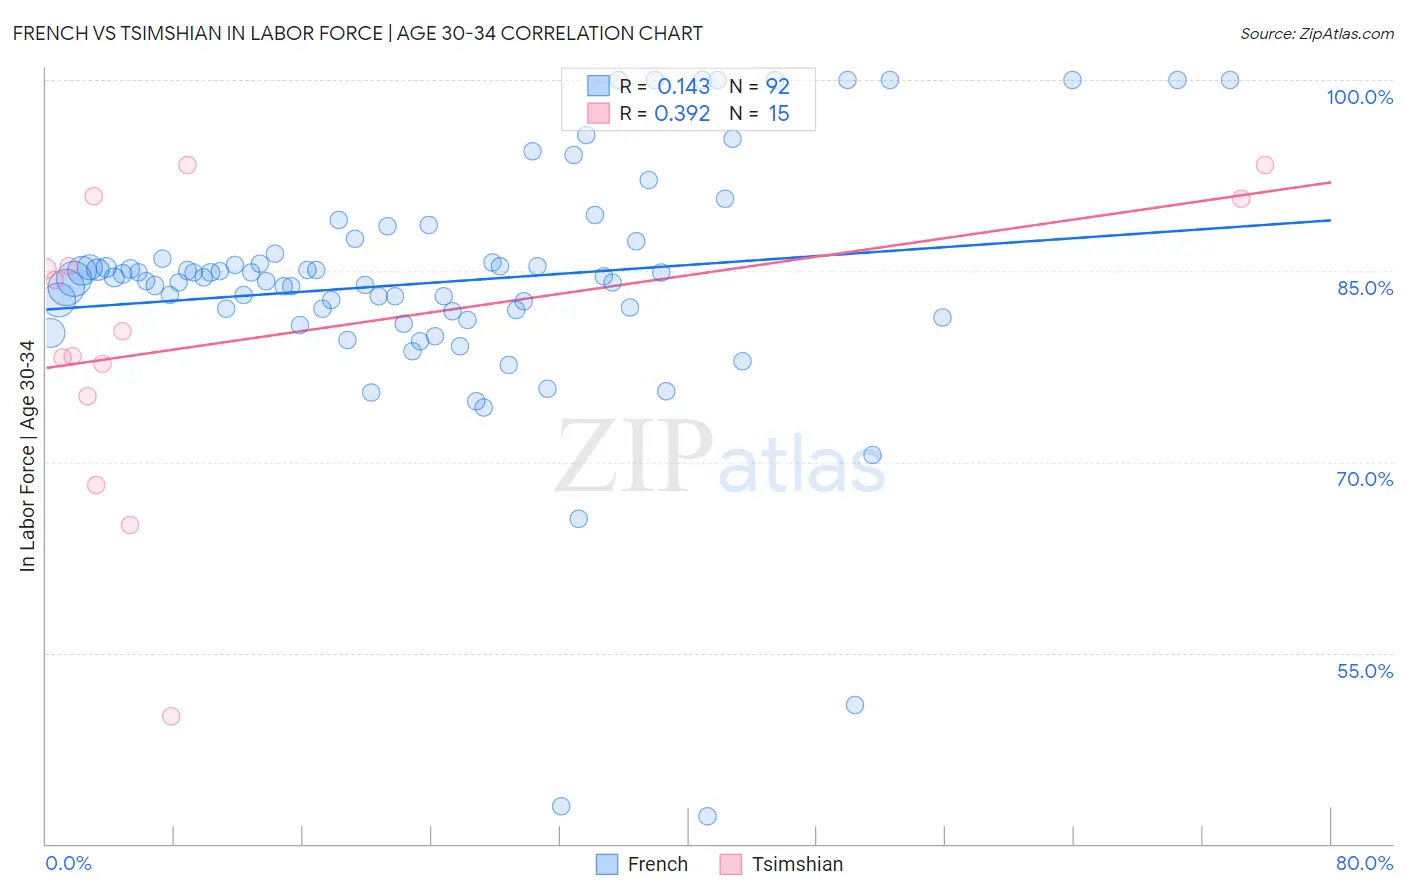
French vs Tsimshian In Labor Force | Age 30-34 Correlation Chart
The statistical analysis conducted on geographies consisting of 571,091,805 people shows a poor positive correlation between the proportion of French and labor force participation rate among population between the ages 30 and 34 in the United States with a correlation coefficient (R) of 0.143 and weighted average of 84.4%. Similarly, the statistical analysis conducted on geographies consisting of 15,624,837 people shows a mild positive correlation between the proportion of Tsimshian and labor force participation rate among population between the ages 30 and 34 in the United States with a correlation coefficient (R) of 0.392 and weighted average of 85.8%, a difference of 1.7%.
In Labor Force | Age 30-34 Correlation Summary
| Measurement | French | Tsimshian |
| Minimum | 42.2% | 50.0% |
| Maximum | 100.0% | 93.3% |
| Range | 57.8% | 43.3% |
| Mean | 84.1% | 79.7% |
| Median | 84.5% | 80.3% |
| Interquartile 25% (IQ1) | 81.9% | 75.2% |
| Interquartile 75% (IQ3) | 86.2% | 90.7% |
| Interquartile Range (IQR) | 4.3% | 15.5% |
| Standard Deviation (Sample) | 10.0% | 11.8% |
| Standard Deviation (Population) | 9.9% | 11.4% |
Similar Demographics by In Labor Force | Age 30-34
Demographics Similar to French by In Labor Force | Age 30-34
In terms of in labor force | age 30-34, the demographic groups most similar to French are Ecuadorian (84.4%, a difference of 0.010%), Canadian (84.4%, a difference of 0.020%), Lebanese (84.4%, a difference of 0.050%), Trinidadian and Tobagonian (84.5%, a difference of 0.060%), and Immigrants from West Indies (84.5%, a difference of 0.060%).
| Demographics | Rating | Rank | In Labor Force | Age 30-34 |
| Dutch | 20.2 /100 | #198 | Fair 84.5% |
| Immigrants | Thailand | 19.1 /100 | #199 | Poor 84.5% |
| Sub-Saharan Africans | 19.0 /100 | #200 | Poor 84.5% |
| Trinidadians and Tobagonians | 18.2 /100 | #201 | Poor 84.5% |
| Immigrants | West Indies | 18.1 /100 | #202 | Poor 84.5% |
| Canadians | 15.4 /100 | #203 | Poor 84.4% |
| Ecuadorians | 14.2 /100 | #204 | Poor 84.4% |
| French | 13.8 /100 | #205 | Poor 84.4% |
| Lebanese | 10.6 /100 | #206 | Poor 84.4% |
| Bangladeshis | 9.4 /100 | #207 | Tragic 84.3% |
| Arabs | 8.9 /100 | #208 | Tragic 84.3% |
| Jamaicans | 8.8 /100 | #209 | Tragic 84.3% |
| Indonesians | 8.8 /100 | #210 | Tragic 84.3% |
| Japanese | 8.8 /100 | #211 | Tragic 84.3% |
| Immigrants | Western Asia | 8.2 /100 | #212 | Tragic 84.3% |
Demographics Similar to Tsimshian by In Labor Force | Age 30-34
In terms of in labor force | age 30-34, the demographic groups most similar to Tsimshian are Immigrants from Latvia (85.9%, a difference of 0.030%), Immigrants from Hong Kong (85.8%, a difference of 0.040%), Paraguayan (85.8%, a difference of 0.050%), Cypriot (85.8%, a difference of 0.060%), and Immigrants from Liberia (85.9%, a difference of 0.070%).
| Demographics | Rating | Rank | In Labor Force | Age 30-34 |
| Bermudans | 100.0 /100 | #22 | Exceptional 85.9% |
| Estonians | 100.0 /100 | #23 | Exceptional 85.9% |
| Immigrants | Eritrea | 100.0 /100 | #24 | Exceptional 85.9% |
| Immigrants | North Macedonia | 100.0 /100 | #25 | Exceptional 85.9% |
| Immigrants | Eastern Africa | 100.0 /100 | #26 | Exceptional 85.9% |
| Immigrants | Liberia | 100.0 /100 | #27 | Exceptional 85.9% |
| Immigrants | Latvia | 100.0 /100 | #28 | Exceptional 85.9% |
| Tsimshian | 100.0 /100 | #29 | Exceptional 85.8% |
| Immigrants | Hong Kong | 100.0 /100 | #30 | Exceptional 85.8% |
| Paraguayans | 99.9 /100 | #31 | Exceptional 85.8% |
| Cypriots | 99.9 /100 | #32 | Exceptional 85.8% |
| Immigrants | Bosnia and Herzegovina | 99.9 /100 | #33 | Exceptional 85.8% |
| Ugandans | 99.9 /100 | #34 | Exceptional 85.8% |
| Serbians | 99.9 /100 | #35 | Exceptional 85.8% |
| Albanians | 99.9 /100 | #36 | Exceptional 85.7% |