Immigrants from Kenya vs Tsimshian In Labor Force | Age 30-34
COMPARE
Immigrants from Kenya
Tsimshian
In Labor Force | Age 30-34
In Labor Force | Age 30-34 Comparison
Immigrants from Kenya
Tsimshian
85.5%
IN LABOR FORCE | AGE 30-34
99.6/ 100
METRIC RATING
54th/ 347
METRIC RANK
85.8%
IN LABOR FORCE | AGE 30-34
100.0/ 100
METRIC RATING
29th/ 347
METRIC RANK
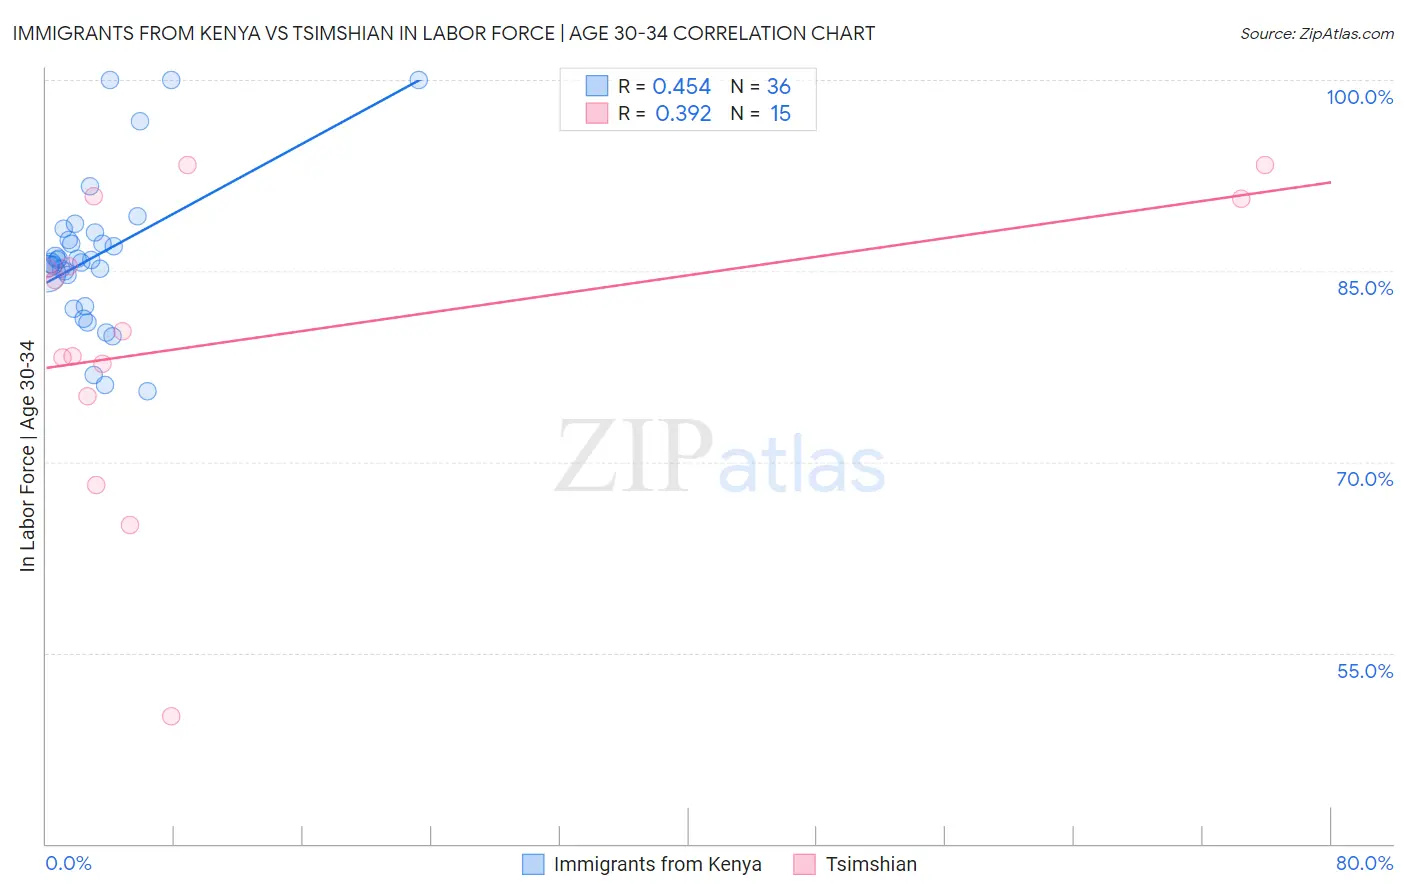
Immigrants from Kenya vs Tsimshian In Labor Force | Age 30-34 Correlation Chart
The statistical analysis conducted on geographies consisting of 217,993,590 people shows a moderate positive correlation between the proportion of Immigrants from Kenya and labor force participation rate among population between the ages 30 and 34 in the United States with a correlation coefficient (R) of 0.454 and weighted average of 85.5%. Similarly, the statistical analysis conducted on geographies consisting of 15,624,837 people shows a mild positive correlation between the proportion of Tsimshian and labor force participation rate among population between the ages 30 and 34 in the United States with a correlation coefficient (R) of 0.392 and weighted average of 85.8%, a difference of 0.40%.
In Labor Force | Age 30-34 Correlation Summary
| Measurement | Immigrants from Kenya | Tsimshian |
| Minimum | 75.5% | 50.0% |
| Maximum | 100.0% | 93.3% |
| Range | 24.5% | 43.3% |
| Mean | 86.2% | 79.7% |
| Median | 85.8% | 80.3% |
| Interquartile 25% (IQ1) | 83.5% | 75.2% |
| Interquartile 75% (IQ3) | 87.7% | 90.7% |
| Interquartile Range (IQR) | 4.3% | 15.5% |
| Standard Deviation (Sample) | 5.9% | 11.8% |
| Standard Deviation (Population) | 5.8% | 11.4% |
Similar Demographics by In Labor Force | Age 30-34
Demographics Similar to Immigrants from Kenya by In Labor Force | Age 30-34
In terms of in labor force | age 30-34, the demographic groups most similar to Immigrants from Kenya are Immigrants from Turkey (85.5%, a difference of 0.0%), Filipino (85.5%, a difference of 0.010%), Czech (85.5%, a difference of 0.010%), Russian (85.5%, a difference of 0.010%), and Polish (85.5%, a difference of 0.020%).
| Demographics | Rating | Rank | In Labor Force | Age 30-34 |
| Croatians | 99.8 /100 | #47 | Exceptional 85.6% |
| Immigrants | Sweden | 99.8 /100 | #48 | Exceptional 85.6% |
| Lithuanians | 99.8 /100 | #49 | Exceptional 85.6% |
| Immigrants | Australia | 99.8 /100 | #50 | Exceptional 85.6% |
| Cape Verdeans | 99.7 /100 | #51 | Exceptional 85.6% |
| Slovenes | 99.7 /100 | #52 | Exceptional 85.6% |
| Filipinos | 99.6 /100 | #53 | Exceptional 85.5% |
| Immigrants | Kenya | 99.6 /100 | #54 | Exceptional 85.5% |
| Immigrants | Turkey | 99.6 /100 | #55 | Exceptional 85.5% |
| Czechs | 99.6 /100 | #56 | Exceptional 85.5% |
| Russians | 99.6 /100 | #57 | Exceptional 85.5% |
| Poles | 99.6 /100 | #58 | Exceptional 85.5% |
| Immigrants | Poland | 99.5 /100 | #59 | Exceptional 85.5% |
| Immigrants | France | 99.5 /100 | #60 | Exceptional 85.5% |
| Immigrants | Brazil | 99.5 /100 | #61 | Exceptional 85.5% |
Demographics Similar to Tsimshian by In Labor Force | Age 30-34
In terms of in labor force | age 30-34, the demographic groups most similar to Tsimshian are Immigrants from Latvia (85.9%, a difference of 0.030%), Immigrants from Hong Kong (85.8%, a difference of 0.040%), Paraguayan (85.8%, a difference of 0.050%), Cypriot (85.8%, a difference of 0.060%), and Immigrants from Liberia (85.9%, a difference of 0.070%).
| Demographics | Rating | Rank | In Labor Force | Age 30-34 |
| Bermudans | 100.0 /100 | #22 | Exceptional 85.9% |
| Estonians | 100.0 /100 | #23 | Exceptional 85.9% |
| Immigrants | Eritrea | 100.0 /100 | #24 | Exceptional 85.9% |
| Immigrants | North Macedonia | 100.0 /100 | #25 | Exceptional 85.9% |
| Immigrants | Eastern Africa | 100.0 /100 | #26 | Exceptional 85.9% |
| Immigrants | Liberia | 100.0 /100 | #27 | Exceptional 85.9% |
| Immigrants | Latvia | 100.0 /100 | #28 | Exceptional 85.9% |
| Tsimshian | 100.0 /100 | #29 | Exceptional 85.8% |
| Immigrants | Hong Kong | 100.0 /100 | #30 | Exceptional 85.8% |
| Paraguayans | 99.9 /100 | #31 | Exceptional 85.8% |
| Cypriots | 99.9 /100 | #32 | Exceptional 85.8% |
| Immigrants | Bosnia and Herzegovina | 99.9 /100 | #33 | Exceptional 85.8% |
| Ugandans | 99.9 /100 | #34 | Exceptional 85.8% |
| Serbians | 99.9 /100 | #35 | Exceptional 85.8% |
| Albanians | 99.9 /100 | #36 | Exceptional 85.7% |