Immigrants from Hungary vs Kiowa In Labor Force | Age 45-54
COMPARE
Immigrants from Hungary
Kiowa
In Labor Force | Age 45-54
In Labor Force | Age 45-54 Comparison
Immigrants from Hungary
Kiowa
82.7%
IN LABOR FORCE | AGE 45-54
37.1/ 100
METRIC RATING
182nd/ 347
METRIC RANK
78.3%
IN LABOR FORCE | AGE 45-54
0.0/ 100
METRIC RATING
323rd/ 347
METRIC RANK
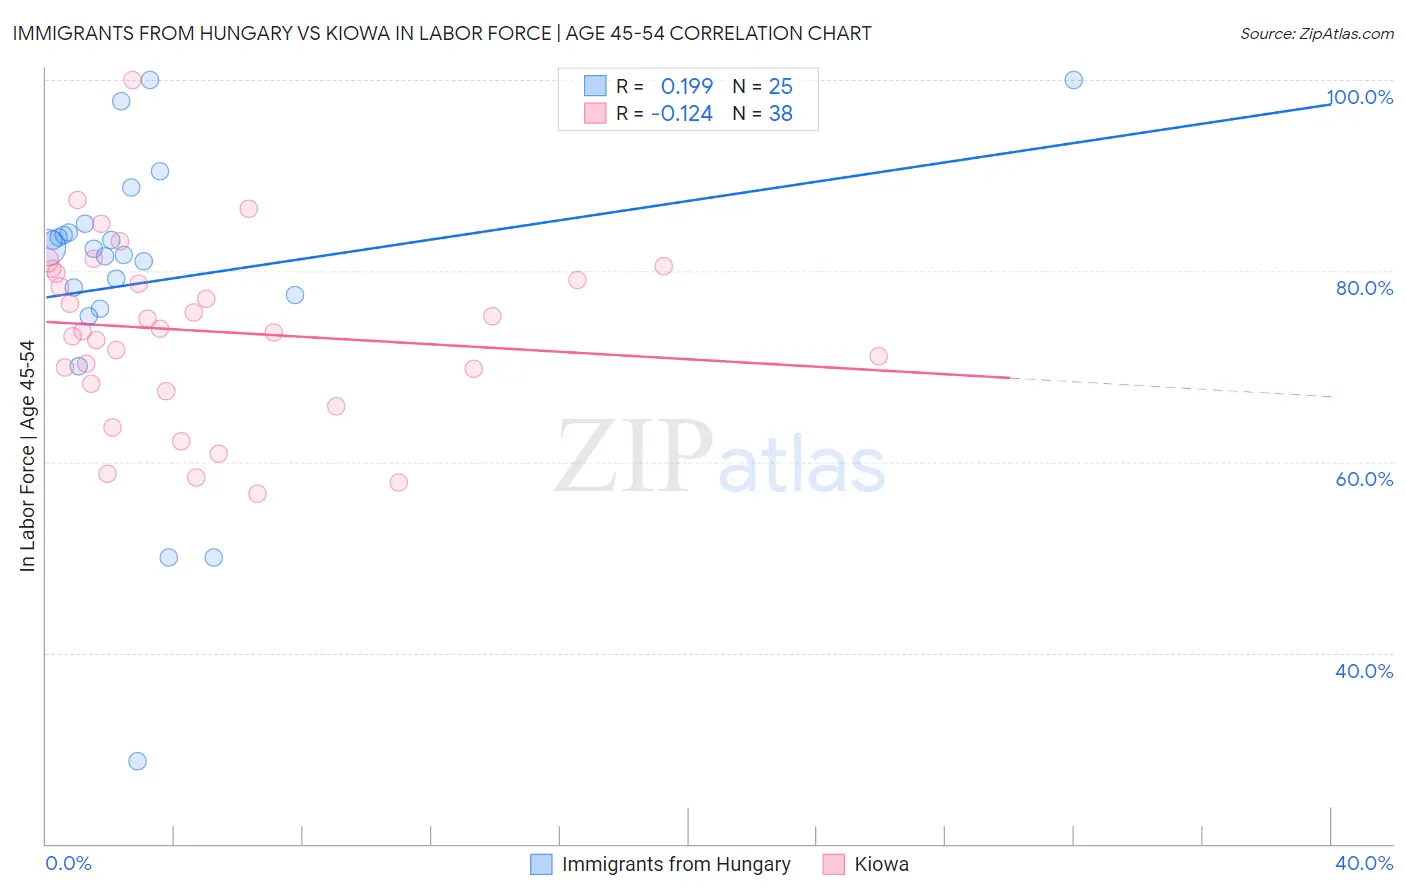
Immigrants from Hungary vs Kiowa In Labor Force | Age 45-54 Correlation Chart
The statistical analysis conducted on geographies consisting of 195,661,497 people shows a poor positive correlation between the proportion of Immigrants from Hungary and labor force participation rate among population between the ages 45 and 54 in the United States with a correlation coefficient (R) of 0.199 and weighted average of 82.7%. Similarly, the statistical analysis conducted on geographies consisting of 56,098,300 people shows a poor negative correlation between the proportion of Kiowa and labor force participation rate among population between the ages 45 and 54 in the United States with a correlation coefficient (R) of -0.124 and weighted average of 78.3%, a difference of 5.6%.
In Labor Force | Age 45-54 Correlation Summary
| Measurement | Immigrants from Hungary | Kiowa |
| Minimum | 28.7% | 56.7% |
| Maximum | 100.0% | 100.0% |
| Range | 71.3% | 43.3% |
| Mean | 78.9% | 73.7% |
| Median | 82.3% | 73.8% |
| Interquartile 25% (IQ1) | 76.7% | 68.2% |
| Interquartile 75% (IQ3) | 84.5% | 79.8% |
| Interquartile Range (IQR) | 7.7% | 11.6% |
| Standard Deviation (Sample) | 15.8% | 9.3% |
| Standard Deviation (Population) | 15.4% | 9.2% |
Similar Demographics by In Labor Force | Age 45-54
Demographics Similar to Immigrants from Hungary by In Labor Force | Age 45-54
In terms of in labor force | age 45-54, the demographic groups most similar to Immigrants from Hungary are Hungarian (82.7%, a difference of 0.010%), Israeli (82.7%, a difference of 0.010%), Immigrants from Switzerland (82.7%, a difference of 0.020%), Nigerian (82.7%, a difference of 0.030%), and New Zealander (82.6%, a difference of 0.040%).
| Demographics | Rating | Rank | In Labor Force | Age 45-54 |
| Immigrants | Liberia | 47.9 /100 | #175 | Average 82.7% |
| Northern Europeans | 46.9 /100 | #176 | Average 82.7% |
| Immigrants | Nicaragua | 44.6 /100 | #177 | Average 82.7% |
| Nigerians | 40.5 /100 | #178 | Average 82.7% |
| Immigrants | Switzerland | 39.4 /100 | #179 | Fair 82.7% |
| Hungarians | 38.0 /100 | #180 | Fair 82.7% |
| Israelis | 37.7 /100 | #181 | Fair 82.7% |
| Immigrants | Hungary | 37.1 /100 | #182 | Fair 82.7% |
| New Zealanders | 32.7 /100 | #183 | Fair 82.6% |
| Europeans | 32.6 /100 | #184 | Fair 82.6% |
| Immigrants | England | 32.2 /100 | #185 | Fair 82.6% |
| Irish | 29.2 /100 | #186 | Fair 82.6% |
| Immigrants | Costa Rica | 28.3 /100 | #187 | Fair 82.6% |
| South Africans | 28.0 /100 | #188 | Fair 82.6% |
| Syrians | 26.0 /100 | #189 | Fair 82.6% |
Demographics Similar to Kiowa by In Labor Force | Age 45-54
In terms of in labor force | age 45-54, the demographic groups most similar to Kiowa are Dutch West Indian (78.2%, a difference of 0.020%), Crow (78.3%, a difference of 0.080%), Choctaw (78.2%, a difference of 0.11%), Seminole (78.1%, a difference of 0.16%), and Cajun (78.1%, a difference of 0.16%).
| Demographics | Rating | Rank | In Labor Force | Age 45-54 |
| Shoshone | 0.0 /100 | #316 | Tragic 79.3% |
| Comanche | 0.0 /100 | #317 | Tragic 79.2% |
| Chickasaw | 0.0 /100 | #318 | Tragic 79.0% |
| Cherokee | 0.0 /100 | #319 | Tragic 79.0% |
| Yaqui | 0.0 /100 | #320 | Tragic 78.9% |
| Yup'ik | 0.0 /100 | #321 | Tragic 78.6% |
| Crow | 0.0 /100 | #322 | Tragic 78.3% |
| Kiowa | 0.0 /100 | #323 | Tragic 78.3% |
| Dutch West Indians | 0.0 /100 | #324 | Tragic 78.2% |
| Choctaw | 0.0 /100 | #325 | Tragic 78.2% |
| Seminole | 0.0 /100 | #326 | Tragic 78.1% |
| Cajuns | 0.0 /100 | #327 | Tragic 78.1% |
| Sioux | 0.0 /100 | #328 | Tragic 78.0% |
| Creek | 0.0 /100 | #329 | Tragic 77.7% |
| Cheyenne | 0.0 /100 | #330 | Tragic 77.6% |