Jordanian vs Kiowa In Labor Force | Age 45-54
COMPARE
Jordanian
Kiowa
In Labor Force | Age 45-54
In Labor Force | Age 45-54 Comparison
Jordanians
Kiowa
83.4%
IN LABOR FORCE | AGE 45-54
96.4/ 100
METRIC RATING
81st/ 347
METRIC RANK
78.3%
IN LABOR FORCE | AGE 45-54
0.0/ 100
METRIC RATING
323rd/ 347
METRIC RANK
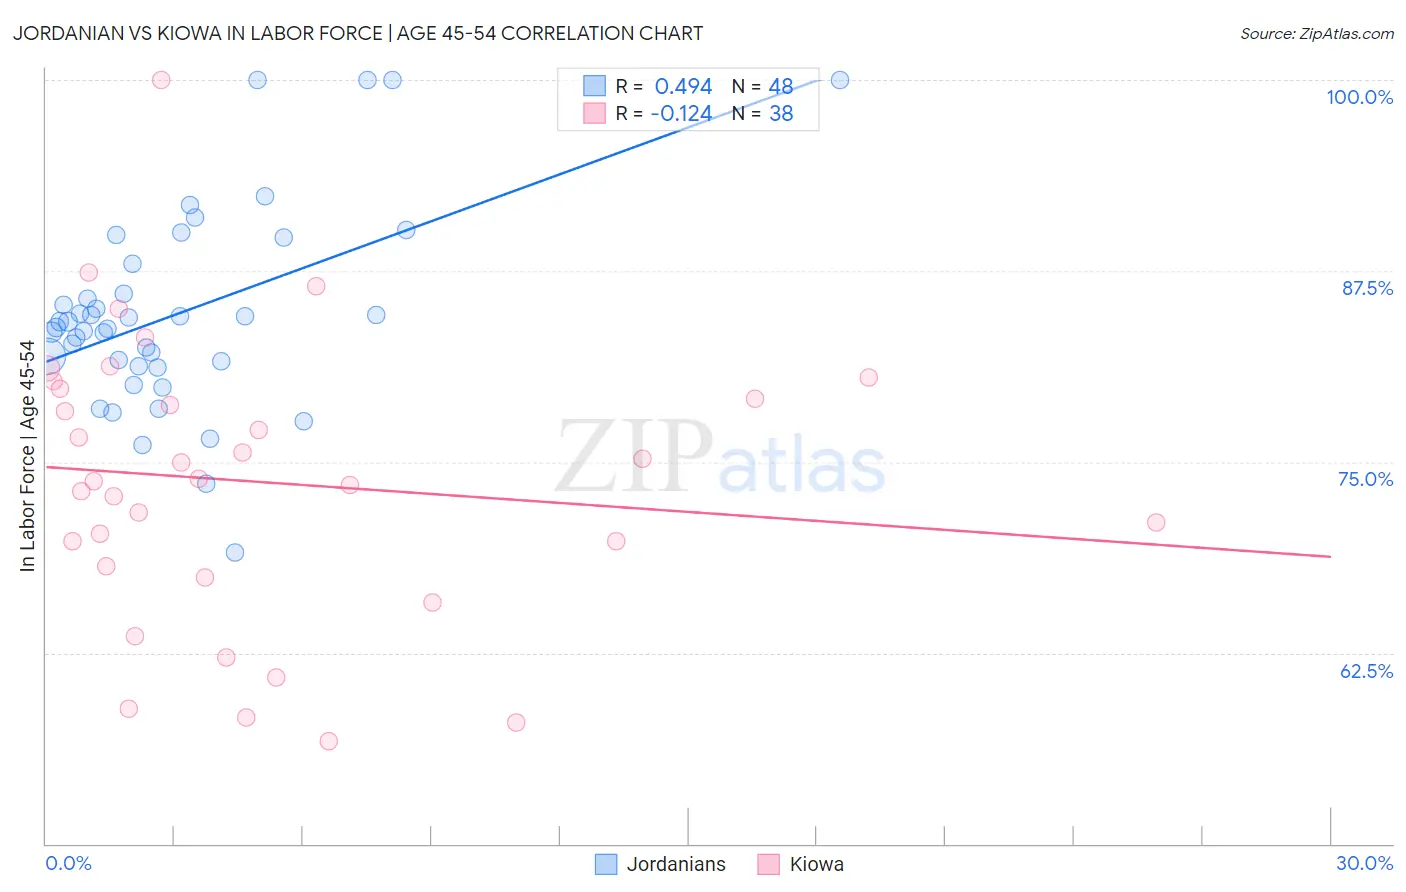
Jordanian vs Kiowa In Labor Force | Age 45-54 Correlation Chart
The statistical analysis conducted on geographies consisting of 166,384,997 people shows a moderate positive correlation between the proportion of Jordanians and labor force participation rate among population between the ages 45 and 54 in the United States with a correlation coefficient (R) of 0.494 and weighted average of 83.4%. Similarly, the statistical analysis conducted on geographies consisting of 56,098,300 people shows a poor negative correlation between the proportion of Kiowa and labor force participation rate among population between the ages 45 and 54 in the United States with a correlation coefficient (R) of -0.124 and weighted average of 78.3%, a difference of 6.5%.
In Labor Force | Age 45-54 Correlation Summary
| Measurement | Jordanian | Kiowa |
| Minimum | 69.1% | 56.7% |
| Maximum | 100.0% | 100.0% |
| Range | 30.9% | 43.3% |
| Mean | 84.7% | 73.7% |
| Median | 84.0% | 73.8% |
| Interquartile 25% (IQ1) | 81.5% | 68.2% |
| Interquartile 75% (IQ3) | 87.0% | 79.8% |
| Interquartile Range (IQR) | 5.6% | 11.6% |
| Standard Deviation (Sample) | 6.5% | 9.3% |
| Standard Deviation (Population) | 6.5% | 9.2% |
Similar Demographics by In Labor Force | Age 45-54
Demographics Similar to Jordanians by In Labor Force | Age 45-54
In terms of in labor force | age 45-54, the demographic groups most similar to Jordanians are Immigrants from Croatia (83.4%, a difference of 0.0%), Immigrants from Egypt (83.4%, a difference of 0.010%), Belgian (83.4%, a difference of 0.010%), Immigrants from Eastern Asia (83.4%, a difference of 0.010%), and Immigrants from Zimbabwe (83.4%, a difference of 0.010%).
| Demographics | Rating | Rank | In Labor Force | Age 45-54 |
| Immigrants | Somalia | 96.9 /100 | #74 | Exceptional 83.4% |
| Estonians | 96.9 /100 | #75 | Exceptional 83.4% |
| Russians | 96.8 /100 | #76 | Exceptional 83.4% |
| Cubans | 96.7 /100 | #77 | Exceptional 83.4% |
| Immigrants | Egypt | 96.6 /100 | #78 | Exceptional 83.4% |
| Belgians | 96.5 /100 | #79 | Exceptional 83.4% |
| Immigrants | Croatia | 96.5 /100 | #80 | Exceptional 83.4% |
| Jordanians | 96.4 /100 | #81 | Exceptional 83.4% |
| Immigrants | Eastern Asia | 96.3 /100 | #82 | Exceptional 83.4% |
| Immigrants | Zimbabwe | 96.3 /100 | #83 | Exceptional 83.4% |
| Immigrants | Bosnia and Herzegovina | 96.0 /100 | #84 | Exceptional 83.3% |
| Greeks | 95.9 /100 | #85 | Exceptional 83.3% |
| Immigrants | Northern Africa | 95.7 /100 | #86 | Exceptional 83.3% |
| Immigrants | Eastern Europe | 95.6 /100 | #87 | Exceptional 83.3% |
| Immigrants | Asia | 95.6 /100 | #88 | Exceptional 83.3% |
Demographics Similar to Kiowa by In Labor Force | Age 45-54
In terms of in labor force | age 45-54, the demographic groups most similar to Kiowa are Dutch West Indian (78.2%, a difference of 0.020%), Crow (78.3%, a difference of 0.080%), Choctaw (78.2%, a difference of 0.11%), Seminole (78.1%, a difference of 0.16%), and Cajun (78.1%, a difference of 0.16%).
| Demographics | Rating | Rank | In Labor Force | Age 45-54 |
| Shoshone | 0.0 /100 | #316 | Tragic 79.3% |
| Comanche | 0.0 /100 | #317 | Tragic 79.2% |
| Chickasaw | 0.0 /100 | #318 | Tragic 79.0% |
| Cherokee | 0.0 /100 | #319 | Tragic 79.0% |
| Yaqui | 0.0 /100 | #320 | Tragic 78.9% |
| Yup'ik | 0.0 /100 | #321 | Tragic 78.6% |
| Crow | 0.0 /100 | #322 | Tragic 78.3% |
| Kiowa | 0.0 /100 | #323 | Tragic 78.3% |
| Dutch West Indians | 0.0 /100 | #324 | Tragic 78.2% |
| Choctaw | 0.0 /100 | #325 | Tragic 78.2% |
| Seminole | 0.0 /100 | #326 | Tragic 78.1% |
| Cajuns | 0.0 /100 | #327 | Tragic 78.1% |
| Sioux | 0.0 /100 | #328 | Tragic 78.0% |
| Creek | 0.0 /100 | #329 | Tragic 77.7% |
| Cheyenne | 0.0 /100 | #330 | Tragic 77.6% |