Immigrants from Guatemala vs Kenyan In Labor Force | Age 45-54
COMPARE
Immigrants from Guatemala
Kenyan
In Labor Force | Age 45-54
In Labor Force | Age 45-54 Comparison
Immigrants from Guatemala
Kenyans
81.1%
IN LABOR FORCE | AGE 45-54
0.0/ 100
METRIC RATING
278th/ 347
METRIC RANK
83.7%
IN LABOR FORCE | AGE 45-54
99.5/ 100
METRIC RATING
34th/ 347
METRIC RANK
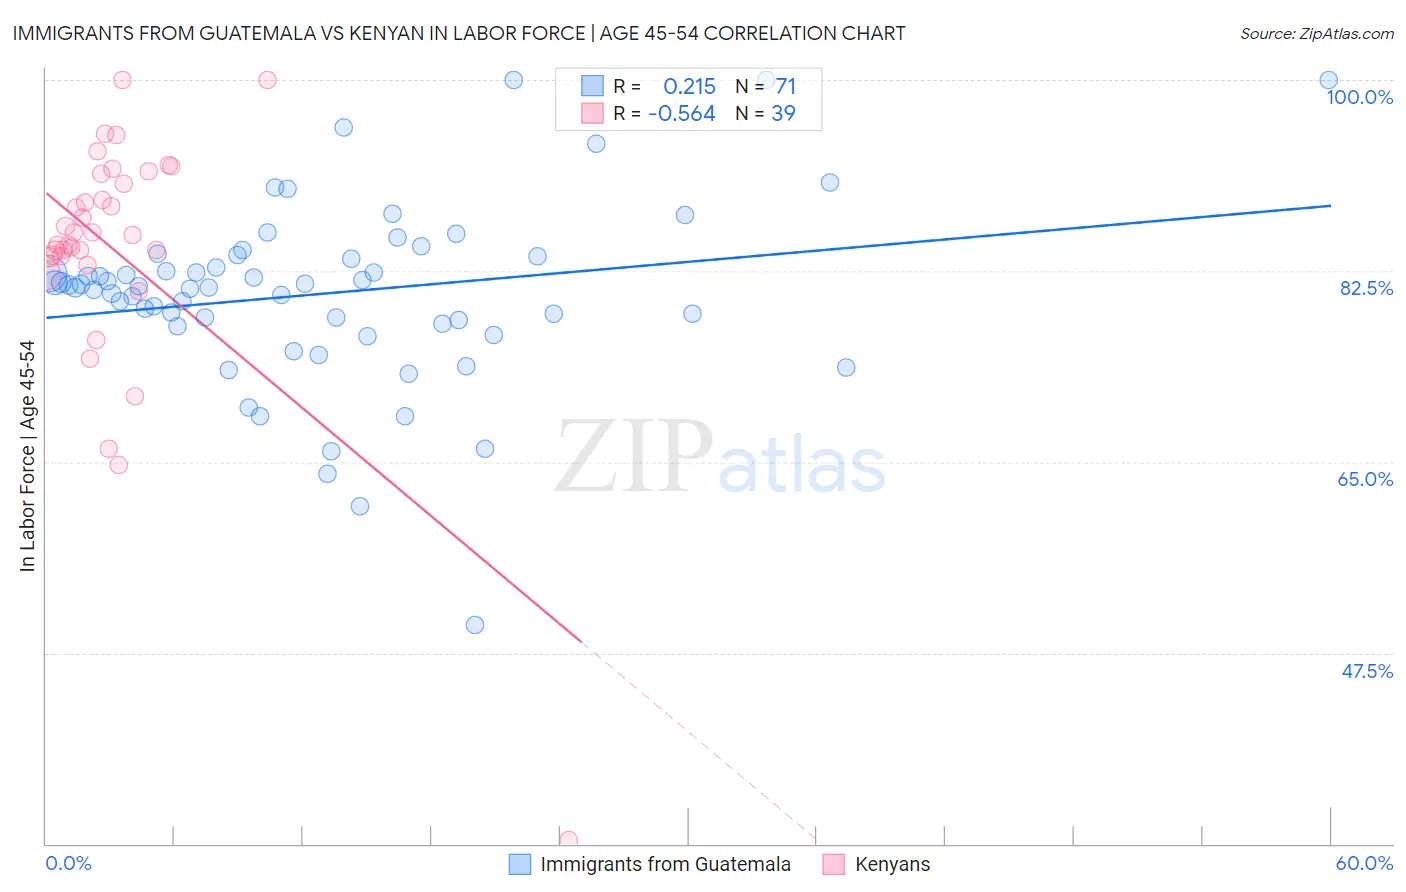
Immigrants from Guatemala vs Kenyan In Labor Force | Age 45-54 Correlation Chart
The statistical analysis conducted on geographies consisting of 377,151,916 people shows a weak positive correlation between the proportion of Immigrants from Guatemala and labor force participation rate among population between the ages 45 and 54 in the United States with a correlation coefficient (R) of 0.215 and weighted average of 81.1%. Similarly, the statistical analysis conducted on geographies consisting of 168,172,450 people shows a substantial negative correlation between the proportion of Kenyans and labor force participation rate among population between the ages 45 and 54 in the United States with a correlation coefficient (R) of -0.564 and weighted average of 83.7%, a difference of 3.2%.
In Labor Force | Age 45-54 Correlation Summary
| Measurement | Immigrants from Guatemala | Kenyan |
| Minimum | 50.0% | 30.4% |
| Maximum | 100.0% | 100.0% |
| Range | 50.0% | 69.6% |
| Mean | 80.4% | 84.4% |
| Median | 81.1% | 85.8% |
| Interquartile 25% (IQ1) | 77.7% | 83.7% |
| Interquartile 75% (IQ3) | 83.8% | 91.4% |
| Interquartile Range (IQR) | 6.1% | 7.7% |
| Standard Deviation (Sample) | 8.3% | 11.7% |
| Standard Deviation (Population) | 8.3% | 11.6% |
Similar Demographics by In Labor Force | Age 45-54
Demographics Similar to Immigrants from Guatemala by In Labor Force | Age 45-54
In terms of in labor force | age 45-54, the demographic groups most similar to Immigrants from Guatemala are Immigrants from Micronesia (81.1%, a difference of 0.010%), Guatemalan (81.2%, a difference of 0.080%), U.S. Virgin Islander (81.2%, a difference of 0.10%), Immigrants from Latin America (81.0%, a difference of 0.11%), and Immigrants from Grenada (81.0%, a difference of 0.12%).
| Demographics | Rating | Rank | In Labor Force | Age 45-54 |
| Immigrants | Barbados | 0.0 /100 | #271 | Tragic 81.3% |
| Spanish | 0.0 /100 | #272 | Tragic 81.3% |
| Chippewa | 0.0 /100 | #273 | Tragic 81.3% |
| British West Indians | 0.0 /100 | #274 | Tragic 81.2% |
| Immigrants | Nonimmigrants | 0.0 /100 | #275 | Tragic 81.2% |
| U.S. Virgin Islanders | 0.0 /100 | #276 | Tragic 81.2% |
| Guatemalans | 0.0 /100 | #277 | Tragic 81.2% |
| Immigrants | Guatemala | 0.0 /100 | #278 | Tragic 81.1% |
| Immigrants | Micronesia | 0.0 /100 | #279 | Tragic 81.1% |
| Immigrants | Latin America | 0.0 /100 | #280 | Tragic 81.0% |
| Immigrants | Grenada | 0.0 /100 | #281 | Tragic 81.0% |
| Aleuts | 0.0 /100 | #282 | Tragic 81.0% |
| French American Indians | 0.0 /100 | #283 | Tragic 80.8% |
| Belizeans | 0.0 /100 | #284 | Tragic 80.8% |
| Delaware | 0.0 /100 | #285 | Tragic 80.8% |
Demographics Similar to Kenyans by In Labor Force | Age 45-54
In terms of in labor force | age 45-54, the demographic groups most similar to Kenyans are Brazilian (83.7%, a difference of 0.0%), Ugandan (83.7%, a difference of 0.0%), Swedish (83.7%, a difference of 0.030%), Immigrants from Venezuela (83.7%, a difference of 0.040%), and Immigrants from Cuba (83.7%, a difference of 0.040%).
| Demographics | Rating | Rank | In Labor Force | Age 45-54 |
| Immigrants | Brazil | 99.8 /100 | #27 | Exceptional 83.9% |
| Immigrants | Lithuania | 99.8 /100 | #28 | Exceptional 83.9% |
| Immigrants | Pakistan | 99.7 /100 | #29 | Exceptional 83.8% |
| Immigrants | Bulgaria | 99.7 /100 | #30 | Exceptional 83.8% |
| Immigrants | Eritrea | 99.7 /100 | #31 | Exceptional 83.8% |
| Turks | 99.7 /100 | #32 | Exceptional 83.8% |
| Latvians | 99.7 /100 | #33 | Exceptional 83.8% |
| Kenyans | 99.5 /100 | #34 | Exceptional 83.7% |
| Brazilians | 99.5 /100 | #35 | Exceptional 83.7% |
| Ugandans | 99.5 /100 | #36 | Exceptional 83.7% |
| Swedes | 99.4 /100 | #37 | Exceptional 83.7% |
| Immigrants | Venezuela | 99.4 /100 | #38 | Exceptional 83.7% |
| Immigrants | Cuba | 99.4 /100 | #39 | Exceptional 83.7% |
| Immigrants | Uganda | 99.4 /100 | #40 | Exceptional 83.7% |
| Immigrants | Korea | 99.3 /100 | #41 | Exceptional 83.7% |