Immigrants from Guatemala vs Immigrants from the Azores In Labor Force | Age 45-54
COMPARE
Immigrants from Guatemala
Immigrants from the Azores
In Labor Force | Age 45-54
In Labor Force | Age 45-54 Comparison
Immigrants from Guatemala
Immigrants from the Azores
81.1%
IN LABOR FORCE | AGE 45-54
0.0/ 100
METRIC RATING
278th/ 347
METRIC RANK
80.1%
IN LABOR FORCE | AGE 45-54
0.0/ 100
METRIC RATING
303rd/ 347
METRIC RANK
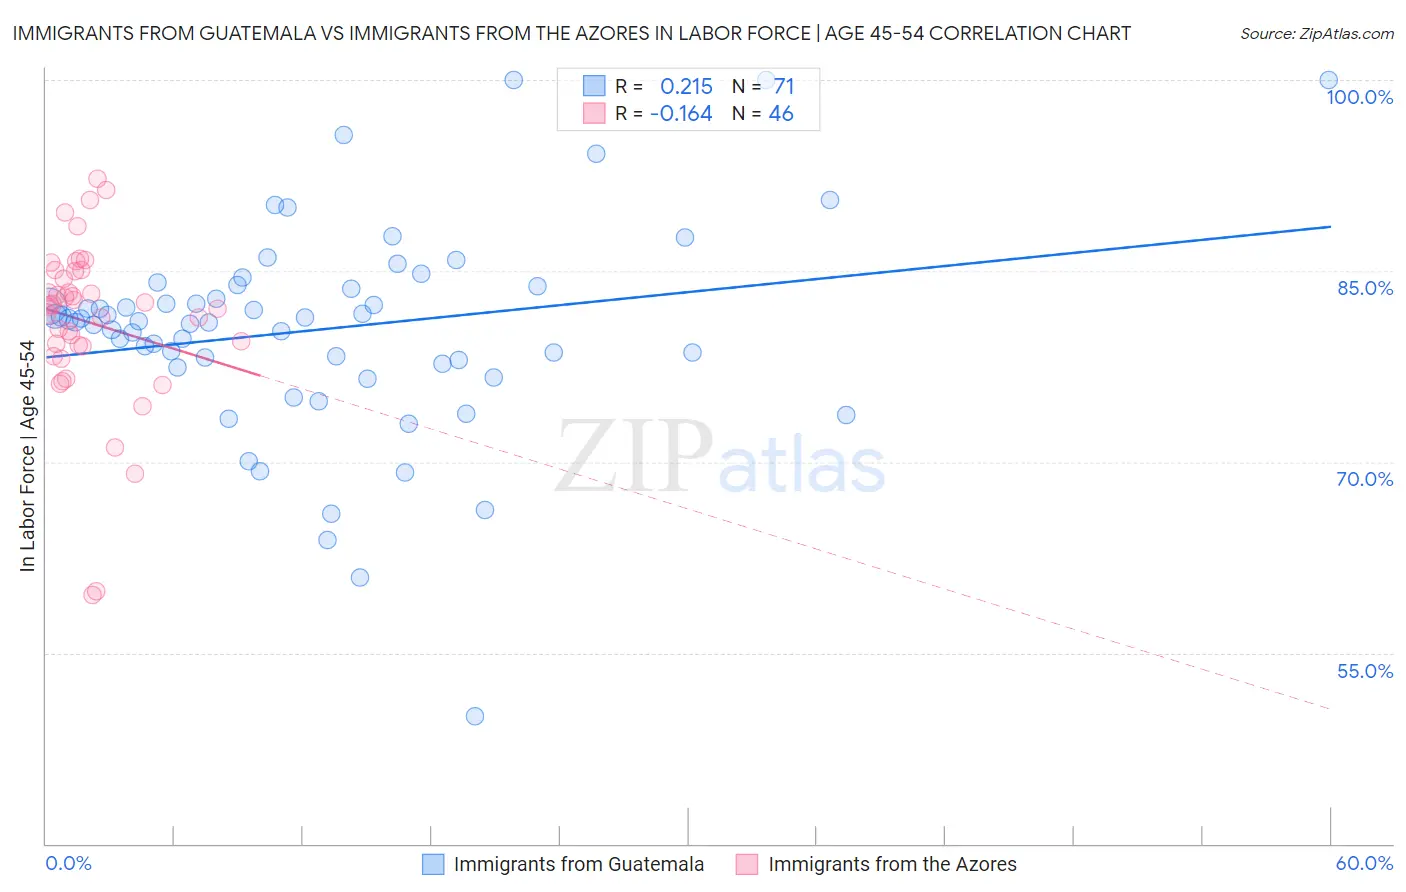
Immigrants from Guatemala vs Immigrants from the Azores In Labor Force | Age 45-54 Correlation Chart
The statistical analysis conducted on geographies consisting of 377,151,916 people shows a weak positive correlation between the proportion of Immigrants from Guatemala and labor force participation rate among population between the ages 45 and 54 in the United States with a correlation coefficient (R) of 0.215 and weighted average of 81.1%. Similarly, the statistical analysis conducted on geographies consisting of 46,256,380 people shows a poor negative correlation between the proportion of Immigrants from the Azores and labor force participation rate among population between the ages 45 and 54 in the United States with a correlation coefficient (R) of -0.164 and weighted average of 80.1%, a difference of 1.2%.
In Labor Force | Age 45-54 Correlation Summary
| Measurement | Immigrants from Guatemala | Immigrants from the Azores |
| Minimum | 50.0% | 59.5% |
| Maximum | 100.0% | 92.2% |
| Range | 50.0% | 32.7% |
| Mean | 80.4% | 81.0% |
| Median | 81.1% | 82.2% |
| Interquartile 25% (IQ1) | 77.7% | 79.1% |
| Interquartile 75% (IQ3) | 83.8% | 85.0% |
| Interquartile Range (IQR) | 6.1% | 5.9% |
| Standard Deviation (Sample) | 8.3% | 6.6% |
| Standard Deviation (Population) | 8.3% | 6.5% |
Similar Demographics by In Labor Force | Age 45-54
Demographics Similar to Immigrants from Guatemala by In Labor Force | Age 45-54
In terms of in labor force | age 45-54, the demographic groups most similar to Immigrants from Guatemala are Immigrants from Micronesia (81.1%, a difference of 0.010%), Guatemalan (81.2%, a difference of 0.080%), U.S. Virgin Islander (81.2%, a difference of 0.10%), Immigrants from Latin America (81.0%, a difference of 0.11%), and Immigrants from Grenada (81.0%, a difference of 0.12%).
| Demographics | Rating | Rank | In Labor Force | Age 45-54 |
| Immigrants | Barbados | 0.0 /100 | #271 | Tragic 81.3% |
| Spanish | 0.0 /100 | #272 | Tragic 81.3% |
| Chippewa | 0.0 /100 | #273 | Tragic 81.3% |
| British West Indians | 0.0 /100 | #274 | Tragic 81.2% |
| Immigrants | Nonimmigrants | 0.0 /100 | #275 | Tragic 81.2% |
| U.S. Virgin Islanders | 0.0 /100 | #276 | Tragic 81.2% |
| Guatemalans | 0.0 /100 | #277 | Tragic 81.2% |
| Immigrants | Guatemala | 0.0 /100 | #278 | Tragic 81.1% |
| Immigrants | Micronesia | 0.0 /100 | #279 | Tragic 81.1% |
| Immigrants | Latin America | 0.0 /100 | #280 | Tragic 81.0% |
| Immigrants | Grenada | 0.0 /100 | #281 | Tragic 81.0% |
| Aleuts | 0.0 /100 | #282 | Tragic 81.0% |
| French American Indians | 0.0 /100 | #283 | Tragic 80.8% |
| Belizeans | 0.0 /100 | #284 | Tragic 80.8% |
| Delaware | 0.0 /100 | #285 | Tragic 80.8% |
Demographics Similar to Immigrants from the Azores by In Labor Force | Age 45-54
In terms of in labor force | age 45-54, the demographic groups most similar to Immigrants from the Azores are Hispanic or Latino (80.1%, a difference of 0.020%), Immigrants from Dominican Republic (80.1%, a difference of 0.030%), Immigrants from Central America (80.2%, a difference of 0.070%), Spanish American (80.1%, a difference of 0.070%), and Spanish American Indian (80.2%, a difference of 0.14%).
| Demographics | Rating | Rank | In Labor Force | Age 45-54 |
| Africans | 0.0 /100 | #296 | Tragic 80.5% |
| Americans | 0.0 /100 | #297 | Tragic 80.4% |
| Marshallese | 0.0 /100 | #298 | Tragic 80.3% |
| Dominicans | 0.0 /100 | #299 | Tragic 80.3% |
| Fijians | 0.0 /100 | #300 | Tragic 80.2% |
| Spanish American Indians | 0.0 /100 | #301 | Tragic 80.2% |
| Immigrants | Central America | 0.0 /100 | #302 | Tragic 80.2% |
| Immigrants | Azores | 0.0 /100 | #303 | Tragic 80.1% |
| Hispanics or Latinos | 0.0 /100 | #304 | Tragic 80.1% |
| Immigrants | Dominican Republic | 0.0 /100 | #305 | Tragic 80.1% |
| Spanish Americans | 0.0 /100 | #306 | Tragic 80.1% |
| Blackfeet | 0.0 /100 | #307 | Tragic 80.0% |
| Central American Indians | 0.0 /100 | #308 | Tragic 80.0% |
| Potawatomi | 0.0 /100 | #309 | Tragic 80.0% |
| Inupiat | 0.0 /100 | #310 | Tragic 79.9% |