Immigrants from Western Asia vs Bahamian In Labor Force | Age 20-24
COMPARE
Immigrants from Western Asia
Bahamian
In Labor Force | Age 20-24
In Labor Force | Age 20-24 Comparison
Immigrants from Western Asia
Bahamians
73.5%
IN LABOR FORCE | AGE 20-24
0.4/ 100
METRIC RATING
267th/ 347
METRIC RANK
73.3%
IN LABOR FORCE | AGE 20-24
0.1/ 100
METRIC RATING
280th/ 347
METRIC RANK
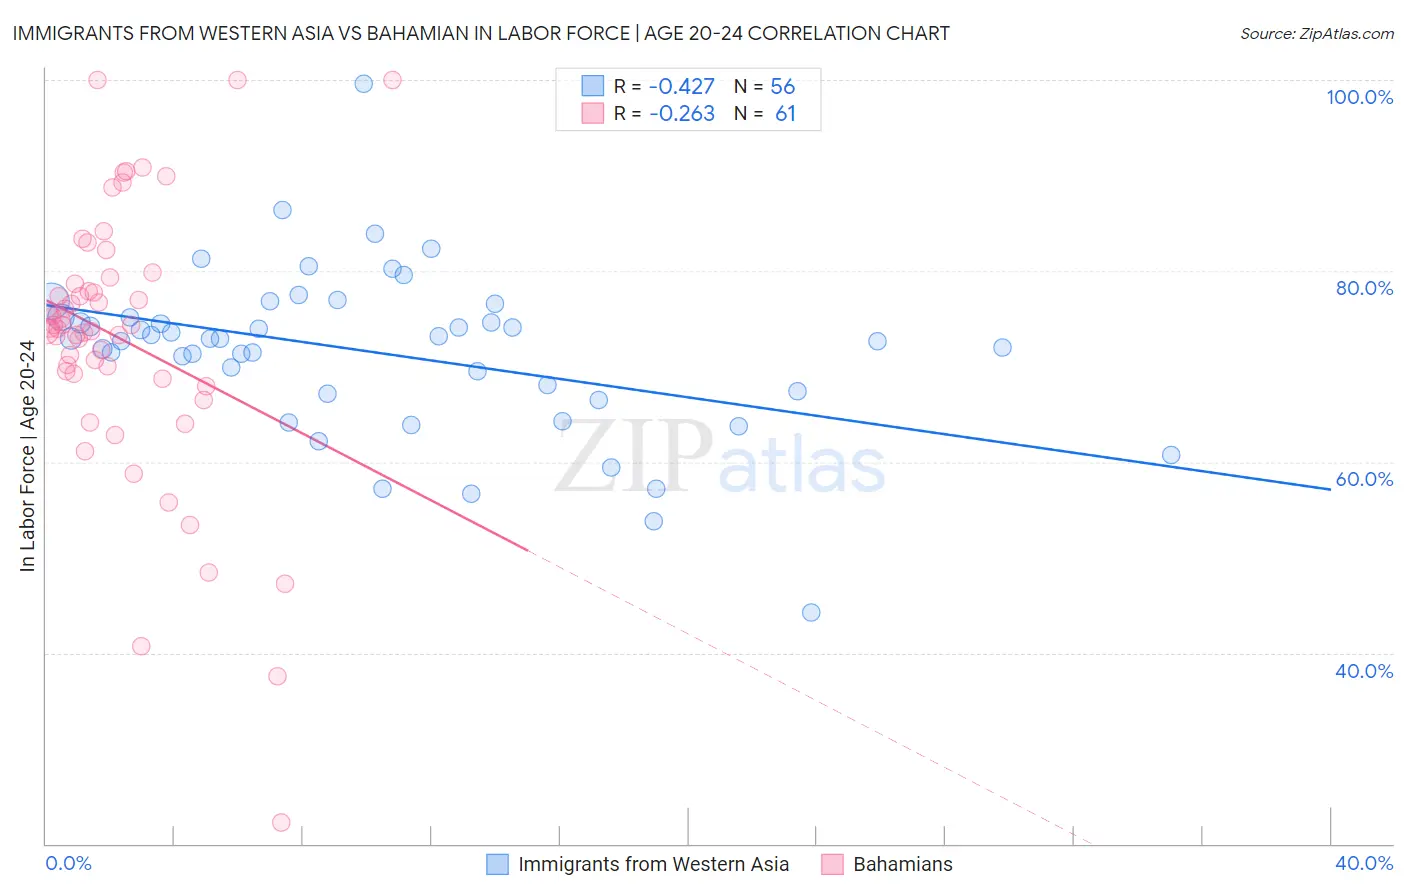
Immigrants from Western Asia vs Bahamian In Labor Force | Age 20-24 Correlation Chart
The statistical analysis conducted on geographies consisting of 404,272,656 people shows a moderate negative correlation between the proportion of Immigrants from Western Asia and labor force participation rate among population between the ages 20 and 24 in the United States with a correlation coefficient (R) of -0.427 and weighted average of 73.5%. Similarly, the statistical analysis conducted on geographies consisting of 112,697,524 people shows a weak negative correlation between the proportion of Bahamians and labor force participation rate among population between the ages 20 and 24 in the United States with a correlation coefficient (R) of -0.263 and weighted average of 73.3%, a difference of 0.39%.
In Labor Force | Age 20-24 Correlation Summary
| Measurement | Immigrants from Western Asia | Bahamian |
| Minimum | 44.2% | 22.2% |
| Maximum | 99.6% | 100.0% |
| Range | 55.4% | 77.8% |
| Mean | 71.5% | 72.9% |
| Median | 72.9% | 74.0% |
| Interquartile 25% (IQ1) | 67.3% | 69.0% |
| Interquartile 75% (IQ3) | 75.1% | 79.0% |
| Interquartile Range (IQR) | 7.9% | 10.0% |
| Standard Deviation (Sample) | 8.7% | 14.3% |
| Standard Deviation (Population) | 8.7% | 14.1% |
Demographics Similar to Immigrants from Western Asia and Bahamians by In Labor Force | Age 20-24
In terms of in labor force | age 20-24, the demographic groups most similar to Immigrants from Western Asia are Burmese (73.6%, a difference of 0.040%), Haitian (73.6%, a difference of 0.040%), Immigrants from Haiti (73.6%, a difference of 0.050%), South American (73.5%, a difference of 0.050%), and Immigrants from Asia (73.6%, a difference of 0.070%). Similarly, the demographic groups most similar to Bahamians are Immigrants from Venezuela (73.2%, a difference of 0.030%), Immigrants from Spain (73.2%, a difference of 0.040%), Immigrants from Bahamas (73.2%, a difference of 0.050%), Venezuelan (73.3%, a difference of 0.070%), and Cypriot (73.3%, a difference of 0.080%).
| Demographics | Rating | Rank | In Labor Force | Age 20-24 |
| Immigrants | Asia | 0.5 /100 | #263 | Tragic 73.6% |
| Immigrants | Haiti | 0.5 /100 | #264 | Tragic 73.6% |
| Burmese | 0.5 /100 | #265 | Tragic 73.6% |
| Haitians | 0.5 /100 | #266 | Tragic 73.6% |
| Immigrants | Western Asia | 0.4 /100 | #267 | Tragic 73.5% |
| South Americans | 0.4 /100 | #268 | Tragic 73.5% |
| Colombians | 0.3 /100 | #269 | Tragic 73.5% |
| Immigrants | Russia | 0.3 /100 | #270 | Tragic 73.5% |
| Immigrants | Indonesia | 0.3 /100 | #271 | Tragic 73.4% |
| Belizeans | 0.3 /100 | #272 | Tragic 73.4% |
| Cheyenne | 0.2 /100 | #273 | Tragic 73.4% |
| Immigrants | Colombia | 0.2 /100 | #274 | Tragic 73.4% |
| Immigrants | South America | 0.2 /100 | #275 | Tragic 73.3% |
| Mongolians | 0.2 /100 | #276 | Tragic 73.3% |
| Immigrants | Malaysia | 0.2 /100 | #277 | Tragic 73.3% |
| Cypriots | 0.2 /100 | #278 | Tragic 73.3% |
| Venezuelans | 0.2 /100 | #279 | Tragic 73.3% |
| Bahamians | 0.1 /100 | #280 | Tragic 73.3% |
| Immigrants | Venezuela | 0.1 /100 | #281 | Tragic 73.2% |
| Immigrants | Spain | 0.1 /100 | #282 | Tragic 73.2% |
| Immigrants | Bahamas | 0.1 /100 | #283 | Tragic 73.2% |