Immigrants from Greece vs Swiss In Labor Force | Age 25-29

COMPARE

Immigrants from Greece
Race
Ancestry
AfghanAfricanAlaska NativeAlaskan AthabascanAlbanianAleutAlsatianAmericanApacheArabArapahoArgentineanArmenianAssyrian/Chaldean/SyriacAustralianAustrianBahamianBangladeshiBarbadianBasqueBelgianBelizeanBermudanBhutaneseBlackfeetBolivianBrazilianBritishBritish West IndianBulgarianBurmeseCajunCambodianCanadianCape VerdeanCarpatho RusynCelticCentral AmericanCentral American IndianCherokeeCheyenneChickasawChileanChineseChippewaChoctawColombianColvilleComancheCosta RicanCreeCreekCroatianCrowCubanCypriotCzechCzechoslovakianDanishDelawareDominicanDutchDutch West IndianEastern EuropeanEcuadorianEgyptianEnglishEstonianEthiopianEuropeanFijianFilipinoFinnishFrenchFrench American IndianFrench CanadianGermanGerman RussianGhanaianGreekGuamanian/ChamorroGuatemalanGuyaneseHaitianHmongHonduranHopiHoumaHungarianIcelanderIndian (Asian)IndonesianInupiatIranianIraqiIrishIroquoisIsraeliItalianJamaicanJapaneseJordanianKenyanKiowaKoreanLaotianLatvianLebaneseLiberianLithuanianLumbeeLuxembourgerMacedonianMalaysianMalteseMarshalleseMenomineeMexicanMexican American IndianMongolianMoroccanNative HawaiianNavajoNepaleseNew ZealanderNicaraguanNigerianNorthern EuropeanNorwegianOkinawanOsageOttawaPaiutePakistaniPalestinianPanamanianParaguayanPennsylvania GermanPeruvianPimaPolishPortuguesePotawatomiPuebloPuerto RicanPuget Sound SalishRomanianRussianSalvadoranSamoanScandinavianScotch-IrishScottishSeminoleSenegaleseSerbianShoshoneSierra LeoneanSiouxSlavicSlovakSloveneSomaliSouth AfricanSouth AmericanSouth American IndianSoviet UnionSpaniardSpanishSpanish AmericanSpanish American IndianSri LankanSubsaharan AfricanSudaneseSwedishSyrianTaiwaneseThaiTlingit-HaidaTohono O'OdhamTonganTrinidadian and TobagonianTsimshianTurkishU.S. Virgin IslanderUgandanUkrainianUruguayanUteVenezuelanVietnameseWelshWest IndianYakamaYaquiYugoslavianYumanYup'ikZimbabwean
Immigration
NonimmigrantsImmigrantsAfghanistanAfricaAlbaniaArgentinaArmeniaAsiaAustraliaAustriaBahamasBangladeshBarbadosBelarusBelgiumBelizeBoliviaBosnia and HerzegovinaBrazilBulgariaBurma/MyanmarCabo VerdeCambodiaCameroonCanadaCaribbeanCentral AmericaChileChinaColombiaCongoCosta RicaCroatiaCubaCzechoslovakiaDenmarkDominicaDominican RepublicEastern AfricaEastern AsiaEastern EuropeEcuadorEgyptEl SalvadorEnglandEritreaEthiopiaEuropeFijiFranceGermanyGhanaGreeceGrenadaGuatemalaGuyanaHaitiHondurasHong KongHungaryIndiaIndonesiaIranIraqIrelandIsraelItalyJamaicaJapanJordanKazakhstanKenyaKoreaKuwaitLaosLatin AmericaLatviaLebanonLiberiaLithuaniaMalaysiaMexicoMicronesiaMiddle AfricaMoldovaMoroccoNepalNetherlandsNicaraguaNigeriaNorth AmericaNorth MacedoniaNorthern AfricaNorthern EuropeNorwayOceaniaPakistanPanamaPeruPhilippinesPolandPortugalRomaniaRussiaSaudi ArabiaScotlandSenegalSerbiaSierra LeoneSingaporeSomaliaSouth AfricaSouth AmericaSouth Central AsiaSouth Eastern AsiaSouthern EuropeSpainSri LankaSt. Vincent and the GrenadinesSudanSwedenSwitzerlandSyriaTaiwanThailandTrinidad and TobagoTurkeyUgandaUkraineUruguayUzbekistanVenezuelaVietnamWest IndiesWestern AfricaWestern AsiaWestern EuropeYemenZaireZimbabweAzores
Swiss
Race
Ancestry
AfghanAfricanAlaska NativeAlaskan AthabascanAlbanianAleutAlsatianAmericanApacheArabArapahoArgentineanArmenianAssyrian/Chaldean/SyriacAustralianAustrianBahamianBangladeshiBarbadianBasqueBelgianBelizeanBermudanBhutaneseBlackfeetBolivianBrazilianBritishBritish West IndianBulgarianBurmeseCajunCambodianCanadianCape VerdeanCarpatho RusynCelticCentral AmericanCentral American IndianCherokeeCheyenneChickasawChileanChineseChippewaChoctawColombianColvilleComancheCosta RicanCreeCreekCroatianCrowCubanCypriotCzechCzechoslovakianDanishDelawareDominicanDutchDutch West IndianEastern EuropeanEcuadorianEgyptianEnglishEstonianEthiopianEuropeanFijianFilipinoFinnishFrenchFrench American IndianFrench CanadianGermanGerman RussianGhanaianGreekGuamanian/ChamorroGuatemalanGuyaneseHaitianHmongHonduranHopiHoumaHungarianIcelanderIndian (Asian)IndonesianInupiatIranianIraqiIrishIroquoisIsraeliItalianJamaicanJapaneseJordanianKenyanKiowaKoreanLaotianLatvianLebaneseLiberianLithuanianLumbeeLuxembourgerMacedonianMalaysianMalteseMarshalleseMenomineeMexicanMexican American IndianMongolianMoroccanNative HawaiianNavajoNepaleseNew ZealanderNicaraguanNigerianNorthern EuropeanNorwegianOkinawanOsageOttawaPaiutePakistaniPalestinianPanamanianParaguayanPennsylvania GermanPeruvianPimaPolishPortuguesePotawatomiPuebloPuerto RicanPuget Sound SalishRomanianRussianSalvadoranSamoanScandinavianScotch-IrishScottishSeminoleSenegaleseSerbianShoshoneSierra LeoneanSiouxSlavicSlovakSloveneSomaliSouth AfricanSouth AmericanSouth American IndianSoviet UnionSpaniardSpanishSpanish AmericanSpanish American IndianSri LankanSubsaharan AfricanSudaneseSwedishSwissSyrianTaiwaneseThaiTlingit-HaidaTohono O'OdhamTonganTrinidadian and TobagonianTsimshianTurkishU.S. Virgin IslanderUgandanUkrainianUruguayanUteVenezuelanVietnameseWelshWest IndianYakamaYaquiYugoslavianYumanYup'ikZimbabwean
Immigration
NonimmigrantsImmigrantsAfghanistanAfricaAlbaniaArgentinaArmeniaAsiaAustraliaAustriaBahamasBangladeshBarbadosBelarusBelgiumBelizeBoliviaBosnia and HerzegovinaBrazilBulgariaBurma/MyanmarCabo VerdeCambodiaCameroonCanadaCaribbeanCentral AmericaChileChinaColombiaCongoCosta RicaCroatiaCubaCzechoslovakiaDenmarkDominicaDominican RepublicEastern AfricaEastern AsiaEastern EuropeEcuadorEgyptEl SalvadorEnglandEritreaEthiopiaEuropeFijiFranceGermanyGhanaGrenadaGuatemalaGuyanaHaitiHondurasHong KongHungaryIndiaIndonesiaIranIraqIrelandIsraelItalyJamaicaJapanJordanKazakhstanKenyaKoreaKuwaitLaosLatin AmericaLatviaLebanonLiberiaLithuaniaMalaysiaMexicoMicronesiaMiddle AfricaMoldovaMoroccoNepalNetherlandsNicaraguaNigeriaNorth AmericaNorth MacedoniaNorthern AfricaNorthern EuropeNorwayOceaniaPakistanPanamaPeruPhilippinesPolandPortugalRomaniaRussiaSaudi ArabiaScotlandSenegalSerbiaSierra LeoneSingaporeSomaliaSouth AfricaSouth AmericaSouth Central AsiaSouth Eastern AsiaSouthern EuropeSpainSri LankaSt. Vincent and the GrenadinesSudanSwedenSwitzerlandSyriaTaiwanThailandTrinidad and TobagoTurkeyUgandaUkraineUruguayUzbekistanVenezuelaVietnamWest IndiesWestern AfricaWestern AsiaWestern EuropeYemenZaireZimbabweAzores
In Labor Force | Age 25-29
Income
Poverty
Unemployment
Labor Participation
Family Structure
Vehicle Availability
Education Level
Disability

In Labor Force | Age 25-29 Comparison

Immigrants from Greece

Swiss

Exceptional
Good
85.7%
IN LABOR FORCE | AGE 25-29
99.9/ 100
METRIC RATING
41st/ 347
METRIC RANK
84.7%
IN LABOR FORCE | AGE 25-29
64.7/ 100
METRIC RATING
150th/ 347
METRIC RANK

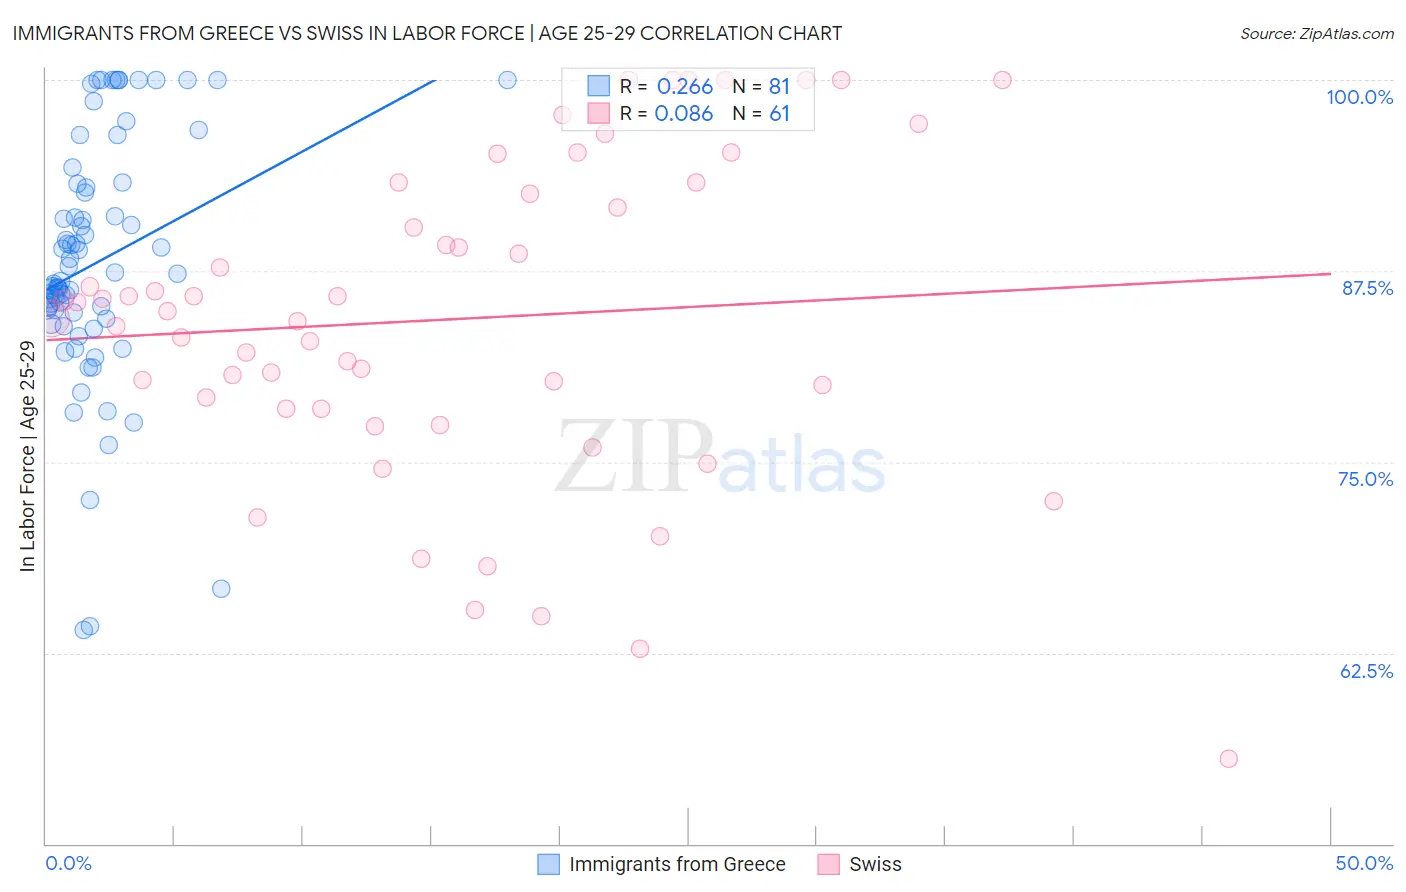
Immigrants from Greece vs Swiss In Labor Force | Age 25-29 Correlation Chart

The statistical analysis conducted on geographies consisting of 216,855,125 people shows a weak positive correlation between the proportion of Immigrants from Greece and labor force participation rate among population between the ages 25 and 29 in the United States with a correlation coefficient (R) of 0.266 and weighted average of 85.7%. Similarly, the statistical analysis conducted on geographies consisting of 464,613,685 people shows a slight positive correlation between the proportion of Swiss and labor force participation rate among population between the ages 25 and 29 in the United States with a correlation coefficient (R) of 0.086 and weighted average of 84.7%, a difference of 1.2%.
Immigrants from Greece vs Swiss In Labor Force | Age 25-29

In Labor Force | Age 25-29 Correlation Summary

MeasurementImmigrants from GreeceSwiss
Minimum64.0%55.6%
Maximum100.0%100.0%
Range36.0%44.4%
Mean88.0%84.4%
Median86.8%84.8%
Interquartile 25% (IQ1)84.6%78.5%
Interquartile 75% (IQ3)93.1%92.9%
Interquartile Range (IQR)8.5%14.4%
Standard Deviation (Sample)8.0%10.5%
Standard Deviation (Population)7.9%10.4%

Similar Demographics by In Labor Force | Age 25-29

Demographics Similar to Immigrants from Greece by In Labor Force | Age 25-29

In terms of in labor force | age 25-29, the demographic groups most similar to Immigrants from Greece are Immigrants from Albania (85.7%, a difference of 0.010%), Sierra Leonean (85.8%, a difference of 0.030%), Croatian (85.8%, a difference of 0.030%), Immigrants from Eritrea (85.7%, a difference of 0.040%), and Polish (85.8%, a difference of 0.050%).
DemographicsRating | RankIn Labor Force | Age 25-29
Lithuanians
99.9
/100
|
#34
Exceptional
85.8%
Cypriots
99.9
/100
|
#35
Exceptional
85.8%
Immigrants | Nepal
99.9
/100
|
#36
Exceptional
85.8%
Poles
99.9
/100
|
#37
Exceptional
85.8%
Sierra Leoneans
99.9
/100
|
#38
Exceptional
85.8%
Croatians
99.9
/100
|
#39
Exceptional
85.8%
Immigrants | Albania
99.9
/100
|
#40
Exceptional
85.7%
Immigrants | Greece
99.9
/100
|
#41
Exceptional
85.7%
Immigrants | Eritrea
99.9
/100
|
#42
Exceptional
85.7%
Immigrants | India
99.9
/100
|
#43
Exceptional
85.7%
Macedonians
99.9
/100
|
#44
Exceptional
85.7%
Immigrants | Sierra Leone
99.9
/100
|
#45
Exceptional
85.7%
Czechs
99.8
/100
|
#46
Exceptional
85.6%
Turks
99.8
/100
|
#47
Exceptional
85.6%
Italians
99.8
/100
|
#48
Exceptional
85.6%

Demographics Similar to Swiss by In Labor Force | Age 25-29

In terms of in labor force | age 25-29, the demographic groups most similar to Swiss are Immigrants from England (84.7%, a difference of 0.0%), Peruvian (84.7%, a difference of 0.0%), Colombian (84.7%, a difference of 0.010%), Immigrants from Pakistan (84.7%, a difference of 0.020%), and Immigrants from Taiwan (84.7%, a difference of 0.020%).
DemographicsRating | RankIn Labor Force | Age 25-29
Sri Lankans
69.2
/100
|
#143
Good
84.8%
Immigrants | Laos
69.0
/100
|
#144
Good
84.8%
Immigrants | Senegal
68.3
/100
|
#145
Good
84.8%
Icelanders
68.2
/100
|
#146
Good
84.8%
Immigrants | Asia
68.2
/100
|
#147
Good
84.8%
Immigrants | England
65.2
/100
|
#148
Good
84.7%
Peruvians
64.7
/100
|
#149
Good
84.7%
Swiss
64.7
/100
|
#150
Good
84.7%
Colombians
62.8
/100
|
#151
Good
84.7%
Immigrants | Pakistan
62.7
/100
|
#152
Good
84.7%
Immigrants | Taiwan
62.2
/100
|
#153
Good
84.7%
Immigrants | Sri Lanka
61.7
/100
|
#154
Good
84.7%
Indians (Asian)
61.6
/100
|
#155
Good
84.7%
French
61.0
/100
|
#156
Good
84.7%
British
60.4
/100
|
#157
Good
84.7%