Immigrants from Latvia vs Swiss In Labor Force | Age 25-29
COMPARE
Immigrants from Latvia
Swiss
In Labor Force | Age 25-29
In Labor Force | Age 25-29 Comparison
Immigrants from Latvia
Swiss
85.6%
IN LABOR FORCE | AGE 25-29
99.8/ 100
METRIC RATING
51st/ 347
METRIC RANK
84.7%
IN LABOR FORCE | AGE 25-29
64.7/ 100
METRIC RATING
150th/ 347
METRIC RANK
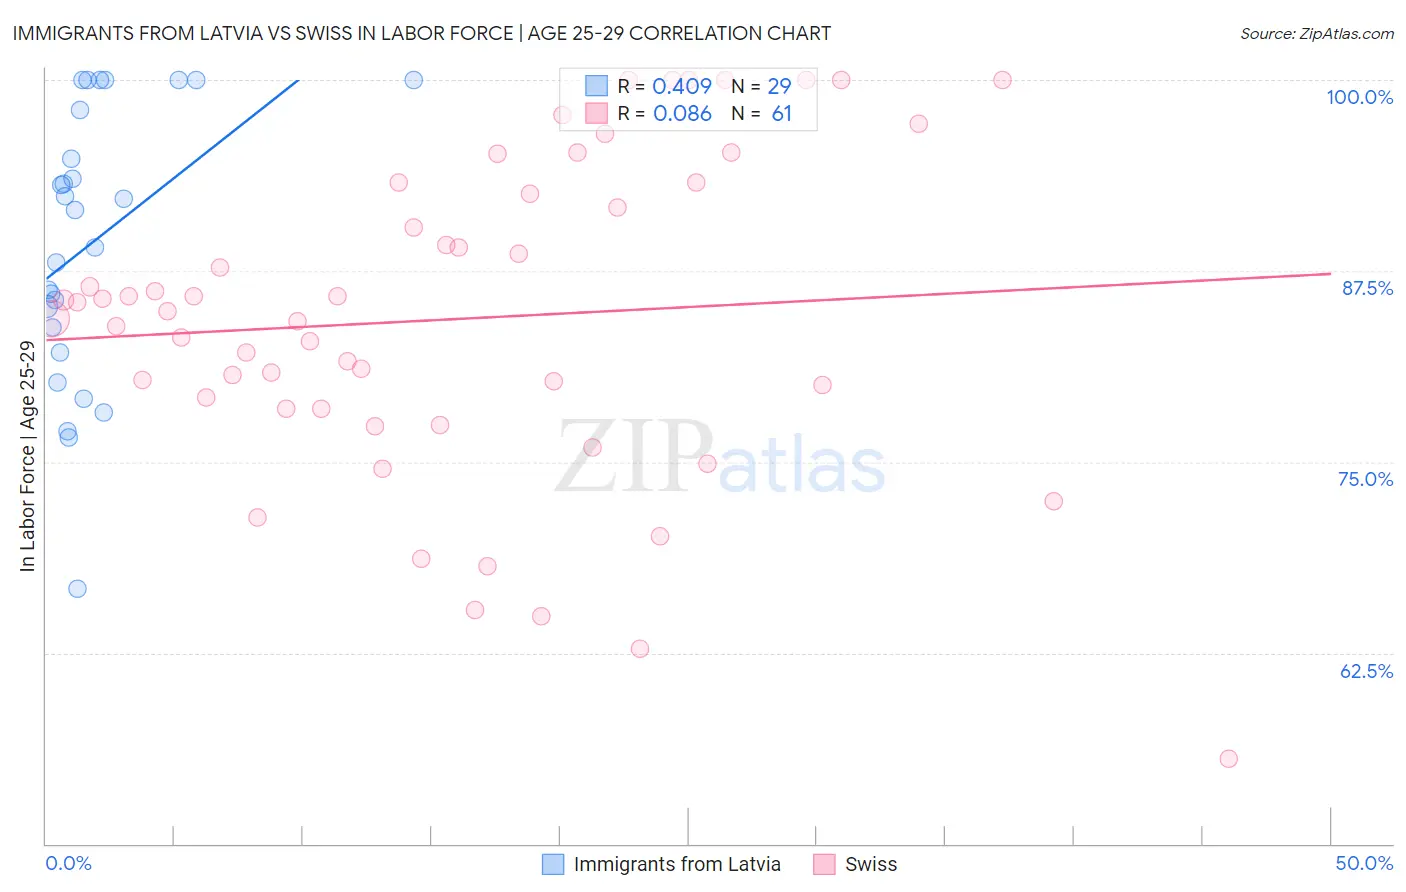
Immigrants from Latvia vs Swiss In Labor Force | Age 25-29 Correlation Chart
The statistical analysis conducted on geographies consisting of 113,730,924 people shows a moderate positive correlation between the proportion of Immigrants from Latvia and labor force participation rate among population between the ages 25 and 29 in the United States with a correlation coefficient (R) of 0.409 and weighted average of 85.6%. Similarly, the statistical analysis conducted on geographies consisting of 464,613,685 people shows a slight positive correlation between the proportion of Swiss and labor force participation rate among population between the ages 25 and 29 in the United States with a correlation coefficient (R) of 0.086 and weighted average of 84.7%, a difference of 0.99%.
In Labor Force | Age 25-29 Correlation Summary
| Measurement | Immigrants from Latvia | Swiss |
| Minimum | 66.7% | 55.6% |
| Maximum | 100.0% | 100.0% |
| Range | 33.3% | 44.4% |
| Mean | 89.4% | 84.4% |
| Median | 91.5% | 84.8% |
| Interquartile 25% (IQ1) | 83.0% | 78.5% |
| Interquartile 75% (IQ3) | 99.0% | 92.9% |
| Interquartile Range (IQR) | 16.0% | 14.4% |
| Standard Deviation (Sample) | 9.0% | 10.5% |
| Standard Deviation (Population) | 8.8% | 10.4% |
Similar Demographics by In Labor Force | Age 25-29
Demographics Similar to Immigrants from Latvia by In Labor Force | Age 25-29
In terms of in labor force | age 25-29, the demographic groups most similar to Immigrants from Latvia are Yugoslavian (85.6%, a difference of 0.0%), Immigrants from Poland (85.6%, a difference of 0.020%), Swedish (85.6%, a difference of 0.030%), Italian (85.6%, a difference of 0.040%), and Turkish (85.6%, a difference of 0.050%).
| Demographics | Rating | Rank | In Labor Force | Age 25-29 |
| Macedonians | 99.9 /100 | #44 | Exceptional 85.7% |
| Immigrants | Sierra Leone | 99.9 /100 | #45 | Exceptional 85.7% |
| Czechs | 99.8 /100 | #46 | Exceptional 85.6% |
| Turks | 99.8 /100 | #47 | Exceptional 85.6% |
| Italians | 99.8 /100 | #48 | Exceptional 85.6% |
| Swedes | 99.8 /100 | #49 | Exceptional 85.6% |
| Yugoslavians | 99.8 /100 | #50 | Exceptional 85.6% |
| Immigrants | Latvia | 99.8 /100 | #51 | Exceptional 85.6% |
| Immigrants | Poland | 99.7 /100 | #52 | Exceptional 85.6% |
| Belgians | 99.7 /100 | #53 | Exceptional 85.5% |
| Albanians | 99.7 /100 | #54 | Exceptional 85.5% |
| Immigrants | Brazil | 99.7 /100 | #55 | Exceptional 85.5% |
| Eastern Europeans | 99.6 /100 | #56 | Exceptional 85.5% |
| Estonians | 99.6 /100 | #57 | Exceptional 85.5% |
| Greeks | 99.6 /100 | #58 | Exceptional 85.5% |
Demographics Similar to Swiss by In Labor Force | Age 25-29
In terms of in labor force | age 25-29, the demographic groups most similar to Swiss are Immigrants from England (84.7%, a difference of 0.0%), Peruvian (84.7%, a difference of 0.0%), Colombian (84.7%, a difference of 0.010%), Immigrants from Pakistan (84.7%, a difference of 0.020%), and Immigrants from Taiwan (84.7%, a difference of 0.020%).
| Demographics | Rating | Rank | In Labor Force | Age 25-29 |
| Sri Lankans | 69.2 /100 | #143 | Good 84.8% |
| Immigrants | Laos | 69.0 /100 | #144 | Good 84.8% |
| Immigrants | Senegal | 68.3 /100 | #145 | Good 84.8% |
| Icelanders | 68.2 /100 | #146 | Good 84.8% |
| Immigrants | Asia | 68.2 /100 | #147 | Good 84.8% |
| Immigrants | England | 65.2 /100 | #148 | Good 84.7% |
| Peruvians | 64.7 /100 | #149 | Good 84.7% |
| Swiss | 64.7 /100 | #150 | Good 84.7% |
| Colombians | 62.8 /100 | #151 | Good 84.7% |
| Immigrants | Pakistan | 62.7 /100 | #152 | Good 84.7% |
| Immigrants | Taiwan | 62.2 /100 | #153 | Good 84.7% |
| Immigrants | Sri Lanka | 61.7 /100 | #154 | Good 84.7% |
| Indians (Asian) | 61.6 /100 | #155 | Good 84.7% |
| French | 61.0 /100 | #156 | Good 84.7% |
| British | 60.4 /100 | #157 | Good 84.7% |