Immigrants from Greece vs Swiss Male Poverty
COMPARE
Immigrants from Greece
Swiss
Male Poverty
Male Poverty Comparison
Immigrants from Greece
Swiss
9.8%
MALE POVERTY
99.3/ 100
METRIC RATING
37th/ 347
METRIC RANK
10.2%
MALE POVERTY
97.5/ 100
METRIC RATING
64th/ 347
METRIC RANK
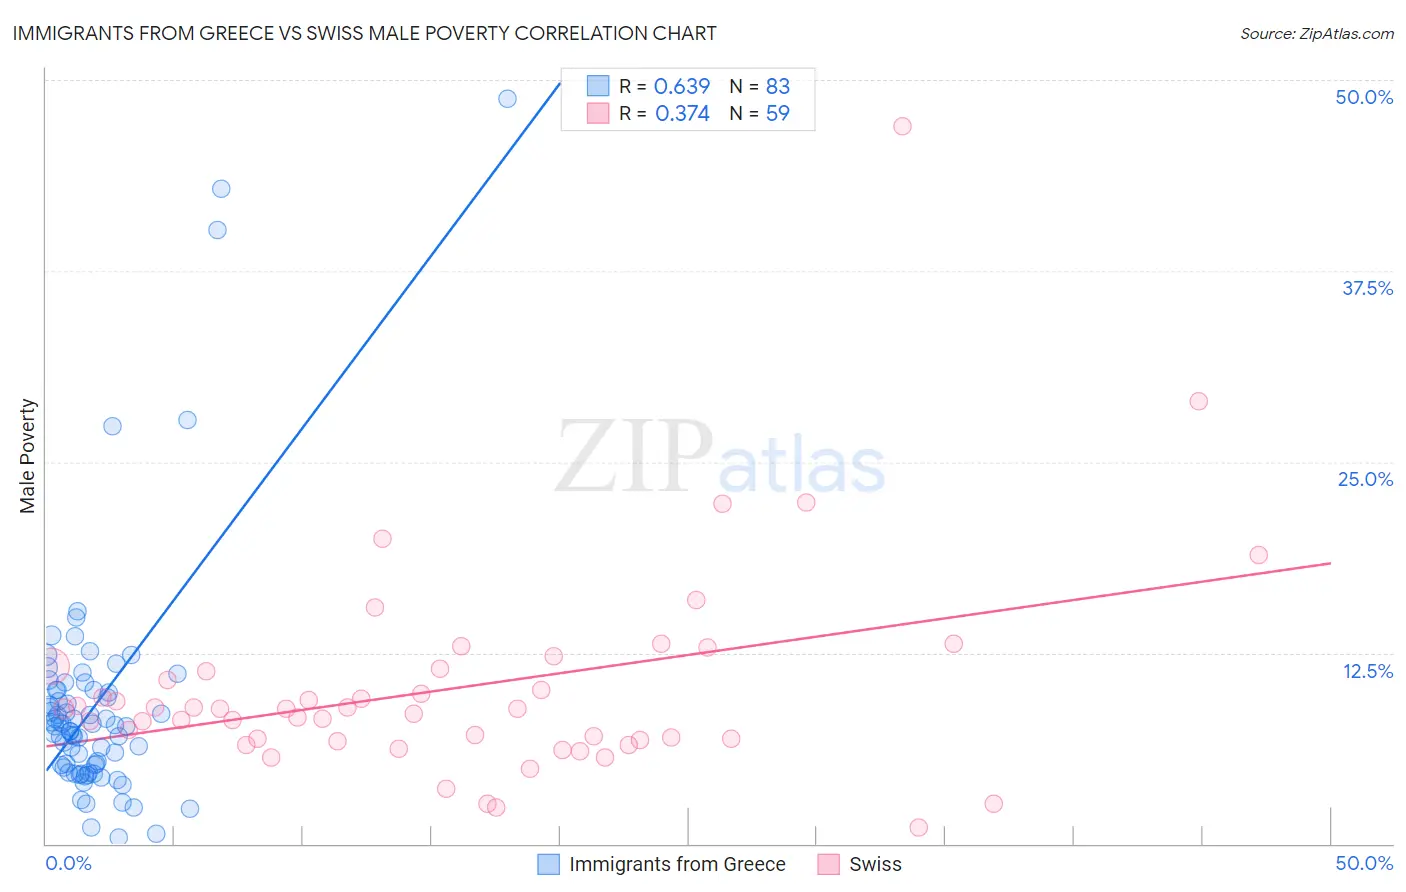
Immigrants from Greece vs Swiss Male Poverty Correlation Chart
The statistical analysis conducted on geographies consisting of 216,804,137 people shows a significant positive correlation between the proportion of Immigrants from Greece and poverty level among males in the United States with a correlation coefficient (R) of 0.639 and weighted average of 9.8%. Similarly, the statistical analysis conducted on geographies consisting of 464,423,995 people shows a mild positive correlation between the proportion of Swiss and poverty level among males in the United States with a correlation coefficient (R) of 0.374 and weighted average of 10.2%, a difference of 3.7%.
Male Poverty Correlation Summary
| Measurement | Immigrants from Greece | Swiss |
| Minimum | 0.43% | 1.1% |
| Maximum | 48.8% | 47.0% |
| Range | 48.3% | 45.9% |
| Mean | 9.2% | 10.2% |
| Median | 7.7% | 8.8% |
| Interquartile 25% (IQ1) | 5.0% | 6.8% |
| Interquartile 75% (IQ3) | 10.1% | 11.4% |
| Interquartile Range (IQR) | 5.1% | 4.7% |
| Standard Deviation (Sample) | 8.1% | 7.0% |
| Standard Deviation (Population) | 8.1% | 6.9% |
Similar Demographics by Male Poverty
Demographics Similar to Immigrants from Greece by Male Poverty
In terms of male poverty, the demographic groups most similar to Immigrants from Greece are Czech (9.8%, a difference of 0.22%), Iranian (9.8%, a difference of 0.31%), Immigrants from Pakistan (9.9%, a difference of 0.37%), Russian (9.9%, a difference of 0.38%), and Cypriot (9.9%, a difference of 0.46%).
| Demographics | Rating | Rank | Male Poverty |
| Poles | 99.5 /100 | #30 | Exceptional 9.7% |
| Tongans | 99.5 /100 | #31 | Exceptional 9.7% |
| Macedonians | 99.5 /100 | #32 | Exceptional 9.7% |
| Immigrants | Northern Europe | 99.5 /100 | #33 | Exceptional 9.7% |
| Immigrants | Poland | 99.5 /100 | #34 | Exceptional 9.8% |
| Iranians | 99.4 /100 | #35 | Exceptional 9.8% |
| Czechs | 99.4 /100 | #36 | Exceptional 9.8% |
| Immigrants | Greece | 99.3 /100 | #37 | Exceptional 9.8% |
| Immigrants | Pakistan | 99.2 /100 | #38 | Exceptional 9.9% |
| Russians | 99.2 /100 | #39 | Exceptional 9.9% |
| Cypriots | 99.2 /100 | #40 | Exceptional 9.9% |
| Koreans | 99.2 /100 | #41 | Exceptional 9.9% |
| Immigrants | Iran | 99.1 /100 | #42 | Exceptional 9.9% |
| Immigrants | Moldova | 99.0 /100 | #43 | Exceptional 9.9% |
| Immigrants | Romania | 98.9 /100 | #44 | Exceptional 9.9% |
Demographics Similar to Swiss by Male Poverty
In terms of male poverty, the demographic groups most similar to Swiss are Zimbabwean (10.2%, a difference of 0.070%), Serbian (10.2%, a difference of 0.080%), Slovak (10.2%, a difference of 0.24%), Immigrants from Netherlands (10.2%, a difference of 0.25%), and Immigrants from Italy (10.2%, a difference of 0.28%).
| Demographics | Rating | Rank | Male Poverty |
| Estonians | 98.1 /100 | #57 | Exceptional 10.1% |
| Scandinavians | 98.0 /100 | #58 | Exceptional 10.1% |
| Immigrants | Europe | 97.9 /100 | #59 | Exceptional 10.1% |
| Ukrainians | 97.9 /100 | #60 | Exceptional 10.1% |
| Austrians | 97.8 /100 | #61 | Exceptional 10.1% |
| Immigrants | Italy | 97.8 /100 | #62 | Exceptional 10.2% |
| Slovaks | 97.7 /100 | #63 | Exceptional 10.2% |
| Swiss | 97.5 /100 | #64 | Exceptional 10.2% |
| Zimbabweans | 97.5 /100 | #65 | Exceptional 10.2% |
| Serbians | 97.5 /100 | #66 | Exceptional 10.2% |
| Immigrants | Netherlands | 97.3 /100 | #67 | Exceptional 10.2% |
| Immigrants | Sri Lanka | 97.2 /100 | #68 | Exceptional 10.2% |
| Immigrants | Australia | 97.1 /100 | #69 | Exceptional 10.2% |
| Paraguayans | 97.1 /100 | #70 | Exceptional 10.2% |
| Europeans | 97.1 /100 | #71 | Exceptional 10.2% |