Immigrants from Greece vs Spanish American Indian Unemployment Among Ages 16 to 19 years
COMPARE
Immigrants from Greece
Spanish American Indian
Unemployment Among Ages 16 to 19 years
Unemployment Among Ages 16 to 19 years Comparison
Immigrants from Greece
Spanish American Indians
18.1%
UNEMPLOYMENT AMONG AGES 16 TO 19 YEARS
7.1/ 100
METRIC RATING
228th/ 347
METRIC RANK
18.9%
UNEMPLOYMENT AMONG AGES 16 TO 19 YEARS
0.1/ 100
METRIC RATING
261st/ 347
METRIC RANK
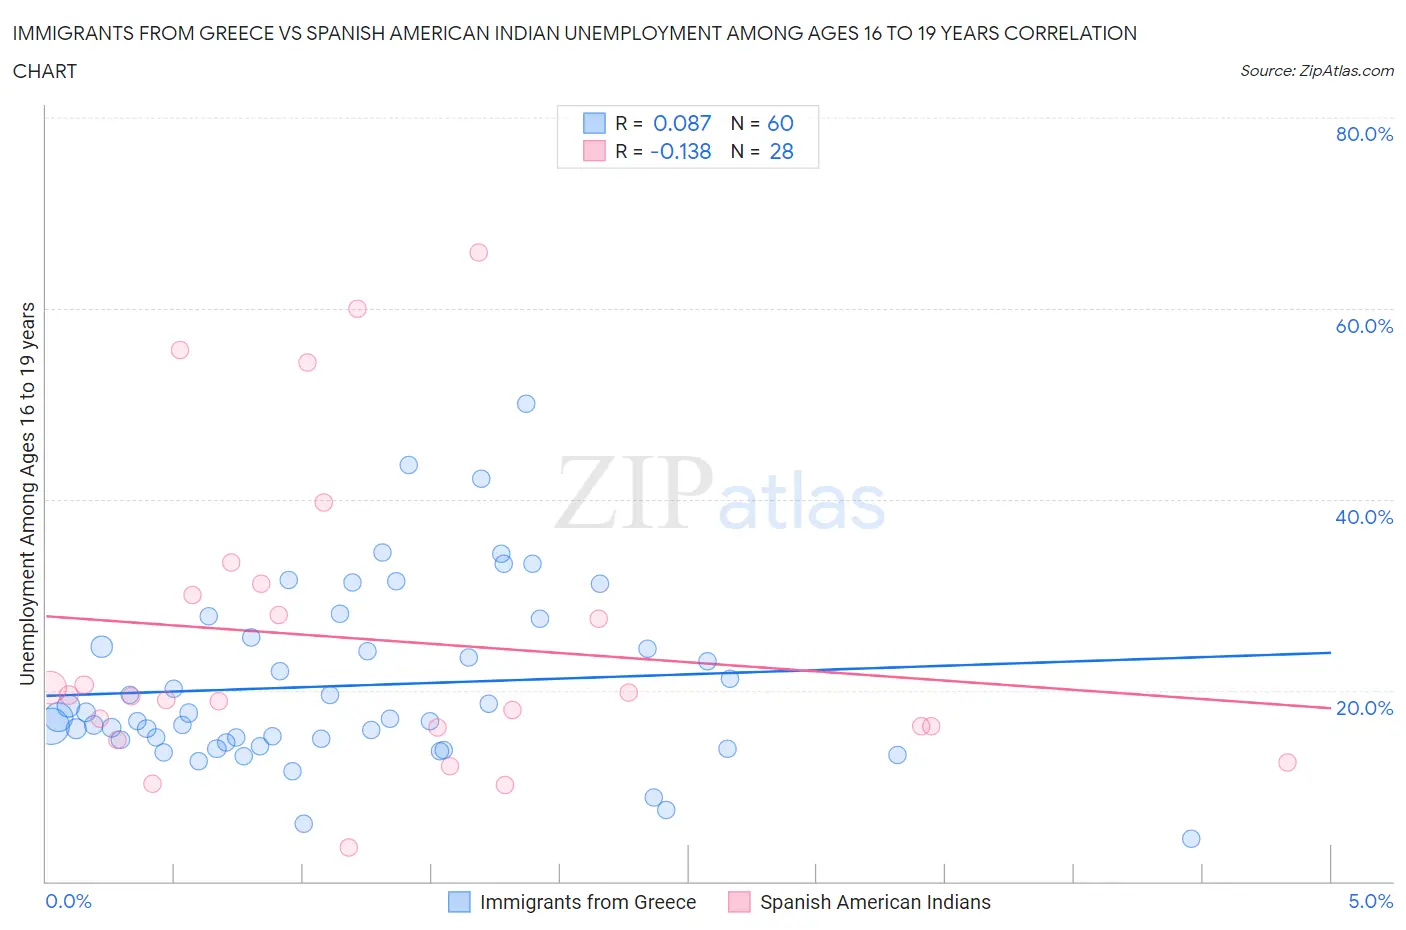
Immigrants from Greece vs Spanish American Indian Unemployment Among Ages 16 to 19 years Correlation Chart
The statistical analysis conducted on geographies consisting of 208,383,876 people shows a slight positive correlation between the proportion of Immigrants from Greece and unemployment rate among population between the ages 16 and 19 in the United States with a correlation coefficient (R) of 0.087 and weighted average of 18.1%. Similarly, the statistical analysis conducted on geographies consisting of 72,445,016 people shows a poor negative correlation between the proportion of Spanish American Indians and unemployment rate among population between the ages 16 and 19 in the United States with a correlation coefficient (R) of -0.138 and weighted average of 18.9%, a difference of 4.5%.
Unemployment Among Ages 16 to 19 years Correlation Summary
| Measurement | Immigrants from Greece | Spanish American Indian |
| Minimum | 4.5% | 3.5% |
| Maximum | 50.0% | 65.8% |
| Range | 45.5% | 62.3% |
| Mean | 20.5% | 25.3% |
| Median | 17.1% | 19.5% |
| Interquartile 25% (IQ1) | 14.7% | 16.2% |
| Interquartile 75% (IQ3) | 25.1% | 30.6% |
| Interquartile Range (IQR) | 10.4% | 14.4% |
| Standard Deviation (Sample) | 9.2% | 16.0% |
| Standard Deviation (Population) | 9.1% | 15.7% |
Similar Demographics by Unemployment Among Ages 16 to 19 years
Demographics Similar to Immigrants from Greece by Unemployment Among Ages 16 to 19 years
In terms of unemployment among ages 16 to 19 years, the demographic groups most similar to Immigrants from Greece are Immigrants from Liberia (18.1%, a difference of 0.010%), Immigrants from Belgium (18.1%, a difference of 0.040%), Immigrants from Chile (18.1%, a difference of 0.070%), Immigrants from Serbia (18.1%, a difference of 0.19%), and Albanian (18.2%, a difference of 0.25%).
| Demographics | Rating | Rank | Unemployment Among Ages 16 to 19 years |
| Immigrants | Spain | 11.4 /100 | #221 | Poor 18.0% |
| Immigrants | Iran | 10.7 /100 | #222 | Poor 18.0% |
| Immigrants | Western Asia | 10.2 /100 | #223 | Poor 18.0% |
| Immigrants | Serbia | 8.3 /100 | #224 | Tragic 18.1% |
| Immigrants | Chile | 7.5 /100 | #225 | Tragic 18.1% |
| Immigrants | Belgium | 7.3 /100 | #226 | Tragic 18.1% |
| Immigrants | Liberia | 7.1 /100 | #227 | Tragic 18.1% |
| Immigrants | Greece | 7.1 /100 | #228 | Tragic 18.1% |
| Albanians | 5.8 /100 | #229 | Tragic 18.2% |
| Spanish Americans | 4.7 /100 | #230 | Tragic 18.2% |
| Nepalese | 4.2 /100 | #231 | Tragic 18.2% |
| Immigrants | Russia | 4.0 /100 | #232 | Tragic 18.2% |
| Seminole | 4.0 /100 | #233 | Tragic 18.2% |
| Colombians | 3.7 /100 | #234 | Tragic 18.3% |
| French American Indians | 2.9 /100 | #235 | Tragic 18.3% |
Demographics Similar to Spanish American Indians by Unemployment Among Ages 16 to 19 years
In terms of unemployment among ages 16 to 19 years, the demographic groups most similar to Spanish American Indians are Nigerian (18.9%, a difference of 0.040%), Salvadoran (18.9%, a difference of 0.040%), Immigrants from Central America (18.9%, a difference of 0.12%), Cree (19.0%, a difference of 0.17%), and Immigrants from Mexico (18.9%, a difference of 0.20%).
| Demographics | Rating | Rank | Unemployment Among Ages 16 to 19 years |
| Apache | 0.3 /100 | #254 | Tragic 18.8% |
| Immigrants | Cameroon | 0.3 /100 | #255 | Tragic 18.8% |
| Mexican American Indians | 0.3 /100 | #256 | Tragic 18.8% |
| Immigrants | Nigeria | 0.2 /100 | #257 | Tragic 18.9% |
| Immigrants | Mexico | 0.2 /100 | #258 | Tragic 18.9% |
| Immigrants | Central America | 0.2 /100 | #259 | Tragic 18.9% |
| Nigerians | 0.2 /100 | #260 | Tragic 18.9% |
| Spanish American Indians | 0.1 /100 | #261 | Tragic 18.9% |
| Salvadorans | 0.1 /100 | #262 | Tragic 18.9% |
| Cree | 0.1 /100 | #263 | Tragic 19.0% |
| Yaqui | 0.1 /100 | #264 | Tragic 19.0% |
| Choctaw | 0.1 /100 | #265 | Tragic 19.0% |
| Immigrants | Honduras | 0.1 /100 | #266 | Tragic 19.0% |
| Israelis | 0.1 /100 | #267 | Tragic 19.0% |
| Immigrants | El Salvador | 0.1 /100 | #268 | Tragic 19.1% |