Kenyan vs Indian (Asian) In Labor Force | Age 45-54
COMPARE
Kenyan
Indian (Asian)
In Labor Force | Age 45-54
In Labor Force | Age 45-54 Comparison
Kenyans
Indians (Asian)
83.7%
IN LABOR FORCE | AGE 45-54
99.5/ 100
METRIC RATING
34th/ 347
METRIC RANK
83.3%
IN LABOR FORCE | AGE 45-54
95.5/ 100
METRIC RATING
89th/ 347
METRIC RANK
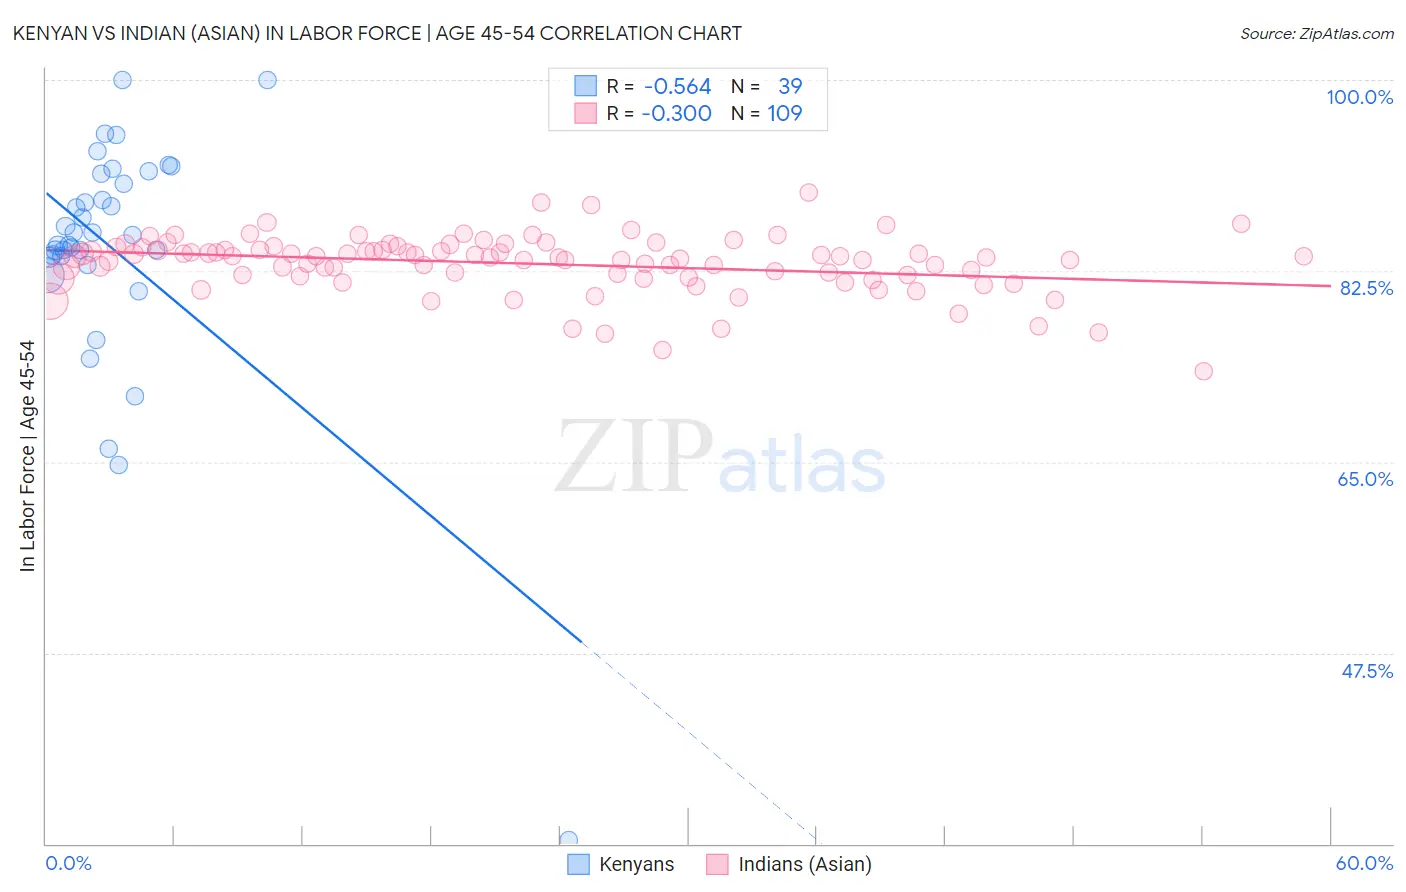
Kenyan vs Indian (Asian) In Labor Force | Age 45-54 Correlation Chart
The statistical analysis conducted on geographies consisting of 168,172,450 people shows a substantial negative correlation between the proportion of Kenyans and labor force participation rate among population between the ages 45 and 54 in the United States with a correlation coefficient (R) of -0.564 and weighted average of 83.7%. Similarly, the statistical analysis conducted on geographies consisting of 494,727,636 people shows a mild negative correlation between the proportion of Indians (Asian) and labor force participation rate among population between the ages 45 and 54 in the United States with a correlation coefficient (R) of -0.300 and weighted average of 83.3%, a difference of 0.48%.
In Labor Force | Age 45-54 Correlation Summary
| Measurement | Kenyan | Indian (Asian) |
| Minimum | 30.4% | 73.3% |
| Maximum | 100.0% | 89.7% |
| Range | 69.6% | 16.4% |
| Mean | 84.4% | 83.2% |
| Median | 85.8% | 83.8% |
| Interquartile 25% (IQ1) | 83.7% | 82.1% |
| Interquartile 75% (IQ3) | 91.4% | 84.6% |
| Interquartile Range (IQR) | 7.7% | 2.5% |
| Standard Deviation (Sample) | 11.7% | 2.6% |
| Standard Deviation (Population) | 11.6% | 2.6% |
Similar Demographics by In Labor Force | Age 45-54
Demographics Similar to Kenyans by In Labor Force | Age 45-54
In terms of in labor force | age 45-54, the demographic groups most similar to Kenyans are Brazilian (83.7%, a difference of 0.0%), Ugandan (83.7%, a difference of 0.0%), Swedish (83.7%, a difference of 0.030%), Immigrants from Venezuela (83.7%, a difference of 0.040%), and Immigrants from Cuba (83.7%, a difference of 0.040%).
| Demographics | Rating | Rank | In Labor Force | Age 45-54 |
| Immigrants | Brazil | 99.8 /100 | #27 | Exceptional 83.9% |
| Immigrants | Lithuania | 99.8 /100 | #28 | Exceptional 83.9% |
| Immigrants | Pakistan | 99.7 /100 | #29 | Exceptional 83.8% |
| Immigrants | Bulgaria | 99.7 /100 | #30 | Exceptional 83.8% |
| Immigrants | Eritrea | 99.7 /100 | #31 | Exceptional 83.8% |
| Turks | 99.7 /100 | #32 | Exceptional 83.8% |
| Latvians | 99.7 /100 | #33 | Exceptional 83.8% |
| Kenyans | 99.5 /100 | #34 | Exceptional 83.7% |
| Brazilians | 99.5 /100 | #35 | Exceptional 83.7% |
| Ugandans | 99.5 /100 | #36 | Exceptional 83.7% |
| Swedes | 99.4 /100 | #37 | Exceptional 83.7% |
| Immigrants | Venezuela | 99.4 /100 | #38 | Exceptional 83.7% |
| Immigrants | Cuba | 99.4 /100 | #39 | Exceptional 83.7% |
| Immigrants | Uganda | 99.4 /100 | #40 | Exceptional 83.7% |
| Immigrants | Korea | 99.3 /100 | #41 | Exceptional 83.7% |
Demographics Similar to Indians (Asian) by In Labor Force | Age 45-54
In terms of in labor force | age 45-54, the demographic groups most similar to Indians (Asian) are Immigrants from Eastern Europe (83.3%, a difference of 0.0%), Immigrants from Asia (83.3%, a difference of 0.0%), Immigrants from Japan (83.3%, a difference of 0.0%), South American (83.3%, a difference of 0.0%), and Immigrants from Northern Africa (83.3%, a difference of 0.010%).
| Demographics | Rating | Rank | In Labor Force | Age 45-54 |
| Immigrants | Eastern Asia | 96.3 /100 | #82 | Exceptional 83.4% |
| Immigrants | Zimbabwe | 96.3 /100 | #83 | Exceptional 83.4% |
| Immigrants | Bosnia and Herzegovina | 96.0 /100 | #84 | Exceptional 83.3% |
| Greeks | 95.9 /100 | #85 | Exceptional 83.3% |
| Immigrants | Northern Africa | 95.7 /100 | #86 | Exceptional 83.3% |
| Immigrants | Eastern Europe | 95.6 /100 | #87 | Exceptional 83.3% |
| Immigrants | Asia | 95.6 /100 | #88 | Exceptional 83.3% |
| Indians (Asian) | 95.5 /100 | #89 | Exceptional 83.3% |
| Immigrants | Japan | 95.5 /100 | #90 | Exceptional 83.3% |
| South Americans | 95.5 /100 | #91 | Exceptional 83.3% |
| Danes | 95.3 /100 | #92 | Exceptional 83.3% |
| Italians | 95.1 /100 | #93 | Exceptional 83.3% |
| Argentineans | 94.9 /100 | #94 | Exceptional 83.3% |
| Immigrants | Argentina | 94.9 /100 | #95 | Exceptional 83.3% |
| Immigrants | Kuwait | 94.8 /100 | #96 | Exceptional 83.3% |