Immigrants from Ghana vs Immigrants from Latin America In Labor Force | Age 20-24
COMPARE
Immigrants from Ghana
Immigrants from Latin America
In Labor Force | Age 20-24
In Labor Force | Age 20-24 Comparison
Immigrants from Ghana
Immigrants from Latin America
74.5%
IN LABOR FORCE | AGE 20-24
12.7/ 100
METRIC RATING
215th/ 347
METRIC RANK
74.1%
IN LABOR FORCE | AGE 20-24
2.7/ 100
METRIC RATING
239th/ 347
METRIC RANK
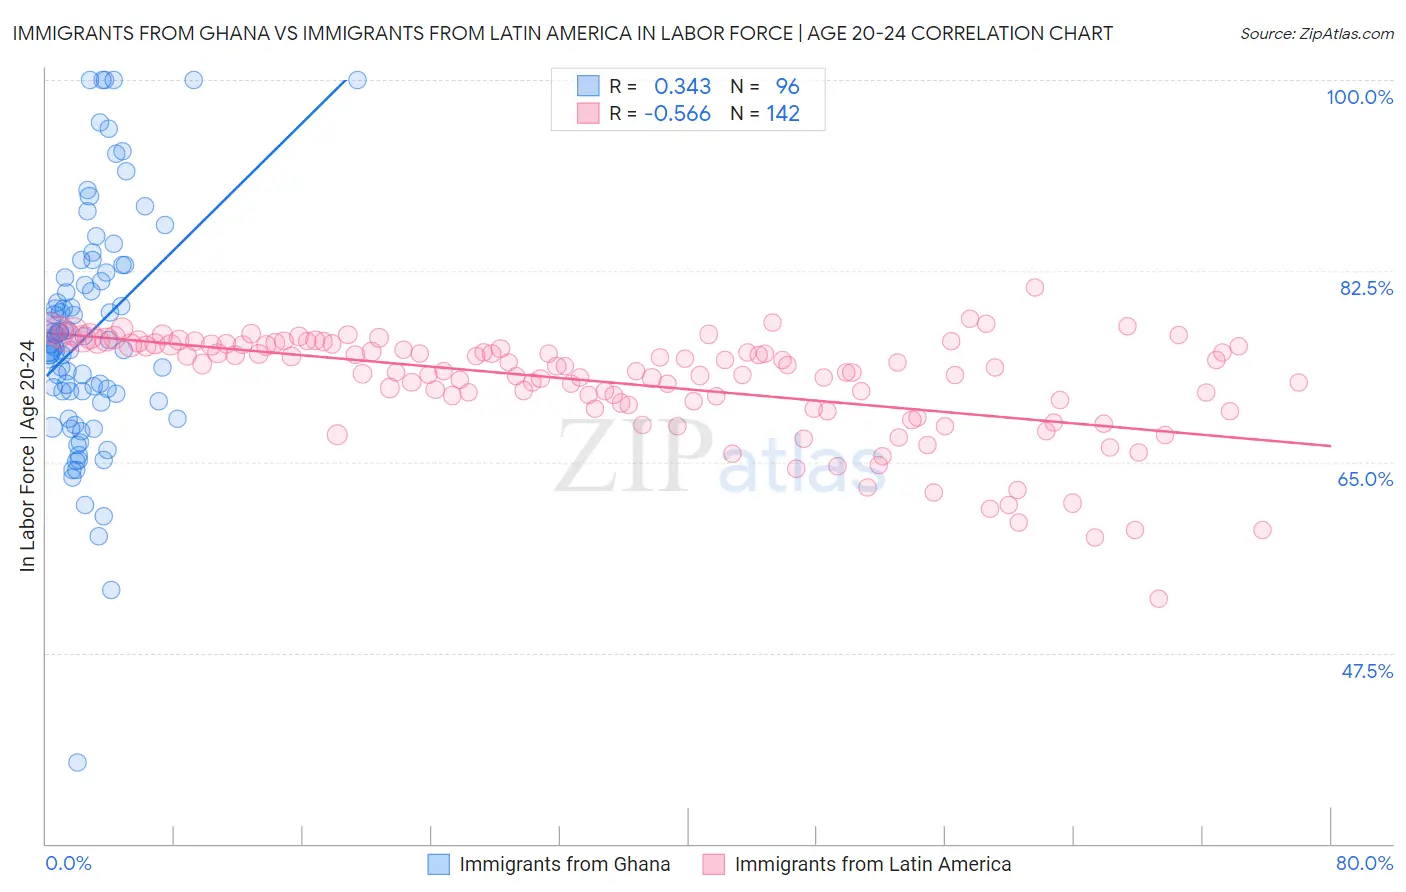
Immigrants from Ghana vs Immigrants from Latin America In Labor Force | Age 20-24 Correlation Chart
The statistical analysis conducted on geographies consisting of 199,952,049 people shows a mild positive correlation between the proportion of Immigrants from Ghana and labor force participation rate among population between the ages 20 and 24 in the United States with a correlation coefficient (R) of 0.343 and weighted average of 74.5%. Similarly, the statistical analysis conducted on geographies consisting of 557,642,628 people shows a substantial negative correlation between the proportion of Immigrants from Latin America and labor force participation rate among population between the ages 20 and 24 in the United States with a correlation coefficient (R) of -0.566 and weighted average of 74.1%, a difference of 0.62%.
In Labor Force | Age 20-24 Correlation Summary
| Measurement | Immigrants from Ghana | Immigrants from Latin America |
| Minimum | 37.5% | 52.4% |
| Maximum | 100.0% | 81.0% |
| Range | 62.5% | 28.6% |
| Mean | 76.8% | 72.2% |
| Median | 76.0% | 73.5% |
| Interquartile 25% (IQ1) | 70.9% | 70.2% |
| Interquartile 75% (IQ3) | 82.1% | 75.7% |
| Interquartile Range (IQR) | 11.2% | 5.6% |
| Standard Deviation (Sample) | 10.8% | 4.9% |
| Standard Deviation (Population) | 10.8% | 4.9% |
Similar Demographics by In Labor Force | Age 20-24
Demographics Similar to Immigrants from Ghana by In Labor Force | Age 20-24
In terms of in labor force | age 20-24, the demographic groups most similar to Immigrants from Ghana are Immigrants from Kuwait (74.5%, a difference of 0.0%), Chilean (74.5%, a difference of 0.010%), Creek (74.5%, a difference of 0.020%), Peruvian (74.5%, a difference of 0.020%), and Immigrants from Southern Europe (74.5%, a difference of 0.020%).
| Demographics | Rating | Rank | In Labor Force | Age 20-24 |
| Immigrants | Uruguay | 15.8 /100 | #208 | Poor 74.6% |
| Arabs | 15.8 /100 | #209 | Poor 74.6% |
| Uruguayans | 15.1 /100 | #210 | Poor 74.6% |
| Immigrants | Australia | 14.7 /100 | #211 | Poor 74.6% |
| Creek | 13.3 /100 | #212 | Poor 74.5% |
| Peruvians | 13.3 /100 | #213 | Poor 74.5% |
| Immigrants | Southern Europe | 13.2 /100 | #214 | Poor 74.5% |
| Immigrants | Ghana | 12.7 /100 | #215 | Poor 74.5% |
| Immigrants | Kuwait | 12.7 /100 | #216 | Poor 74.5% |
| Chileans | 12.5 /100 | #217 | Poor 74.5% |
| Immigrants | Peru | 10.6 /100 | #218 | Poor 74.5% |
| Nepalese | 10.5 /100 | #219 | Poor 74.5% |
| Immigrants | Norway | 10.3 /100 | #220 | Poor 74.5% |
| Chickasaw | 10.3 /100 | #221 | Poor 74.5% |
| Immigrants | India | 9.9 /100 | #222 | Tragic 74.4% |
Demographics Similar to Immigrants from Latin America by In Labor Force | Age 20-24
In terms of in labor force | age 20-24, the demographic groups most similar to Immigrants from Latin America are Immigrants from Japan (74.1%, a difference of 0.040%), Immigrants from Sri Lanka (74.0%, a difference of 0.060%), Bermudan (74.1%, a difference of 0.070%), Immigrants from France (74.1%, a difference of 0.090%), and Immigrants from Senegal (74.0%, a difference of 0.090%).
| Demographics | Rating | Rank | In Labor Force | Age 20-24 |
| Immigrants | Switzerland | 4.1 /100 | #232 | Tragic 74.2% |
| Immigrants | Chile | 3.7 /100 | #233 | Tragic 74.1% |
| Immigrants | Immigrants | 3.6 /100 | #234 | Tragic 74.1% |
| Laotians | 3.5 /100 | #235 | Tragic 74.1% |
| Immigrants | France | 3.3 /100 | #236 | Tragic 74.1% |
| Bermudans | 3.2 /100 | #237 | Tragic 74.1% |
| Immigrants | Japan | 3.0 /100 | #238 | Tragic 74.1% |
| Immigrants | Latin America | 2.7 /100 | #239 | Tragic 74.1% |
| Immigrants | Sri Lanka | 2.3 /100 | #240 | Tragic 74.0% |
| Immigrants | Senegal | 2.1 /100 | #241 | Tragic 74.0% |
| Thais | 2.1 /100 | #242 | Tragic 74.0% |
| Immigrants | Syria | 1.9 /100 | #243 | Tragic 74.0% |
| Immigrants | South Central Asia | 1.9 /100 | #244 | Tragic 74.0% |
| Turks | 1.8 /100 | #245 | Tragic 73.9% |
| Immigrants | Panama | 1.6 /100 | #246 | Tragic 73.9% |