Immigrants from Ghana vs Spanish In Labor Force | Age 16-19
COMPARE
Immigrants from Ghana
Spanish
In Labor Force | Age 16-19
In Labor Force | Age 16-19 Comparison
Immigrants from Ghana
Spanish
35.4%
IN LABOR FORCE | AGE 16-19
7.3/ 100
METRIC RATING
222nd/ 347
METRIC RANK
39.3%
IN LABOR FORCE | AGE 16-19
99.7/ 100
METRIC RATING
83rd/ 347
METRIC RANK
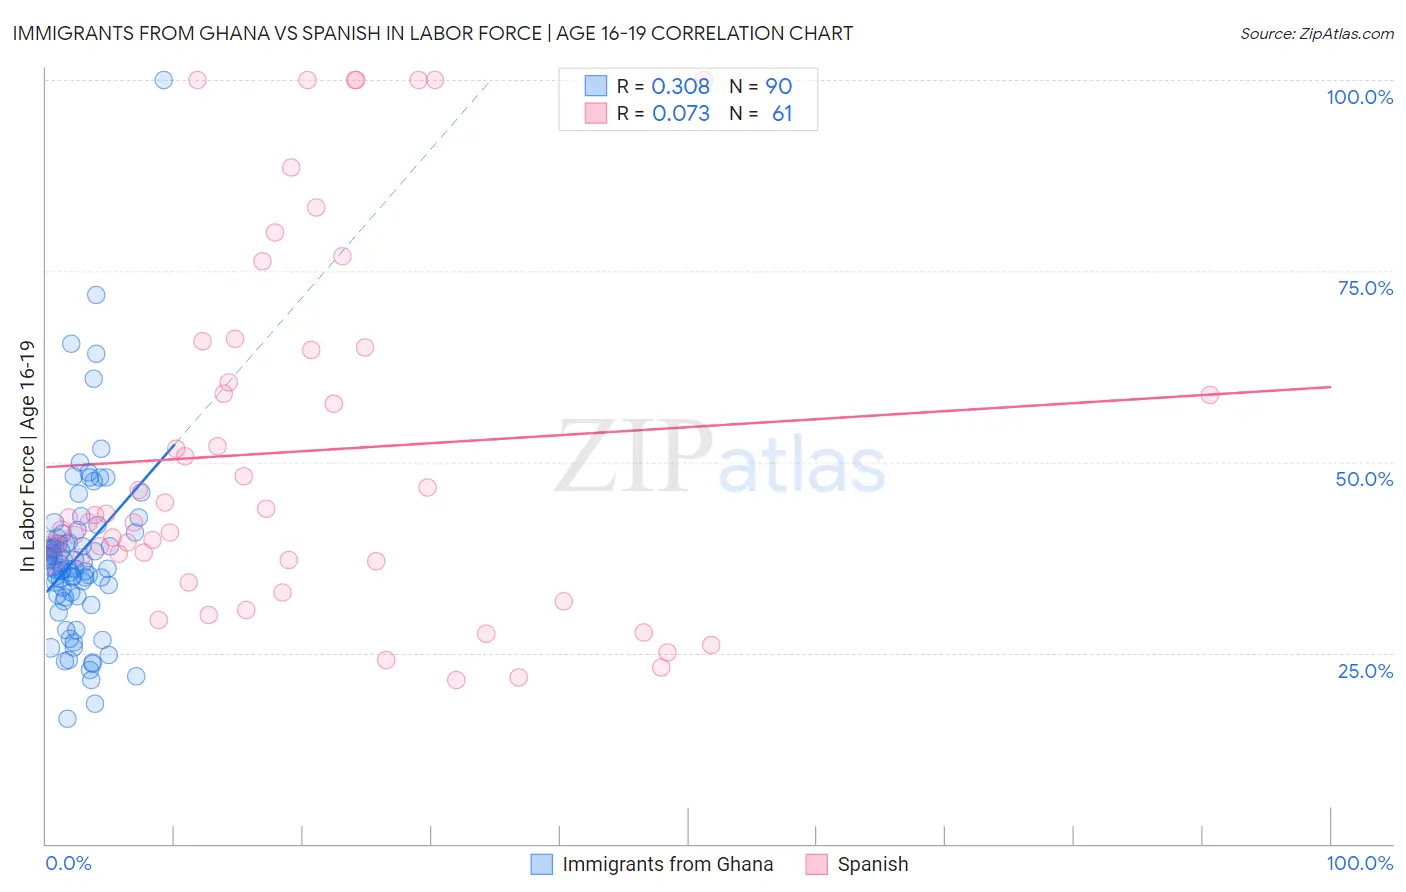
Immigrants from Ghana vs Spanish In Labor Force | Age 16-19 Correlation Chart
The statistical analysis conducted on geographies consisting of 199,826,706 people shows a mild positive correlation between the proportion of Immigrants from Ghana and labor force participation rate among population between the ages 16 and 19 in the United States with a correlation coefficient (R) of 0.308 and weighted average of 35.4%. Similarly, the statistical analysis conducted on geographies consisting of 421,181,243 people shows a slight positive correlation between the proportion of Spanish and labor force participation rate among population between the ages 16 and 19 in the United States with a correlation coefficient (R) of 0.073 and weighted average of 39.3%, a difference of 10.9%.
In Labor Force | Age 16-19 Correlation Summary
| Measurement | Immigrants from Ghana | Spanish |
| Minimum | 16.3% | 21.4% |
| Maximum | 100.0% | 100.0% |
| Range | 83.7% | 78.6% |
| Mean | 37.7% | 51.3% |
| Median | 36.7% | 42.7% |
| Interquartile 25% (IQ1) | 32.5% | 37.1% |
| Interquartile 75% (IQ3) | 40.1% | 64.9% |
| Interquartile Range (IQR) | 7.5% | 27.8% |
| Standard Deviation (Sample) | 11.6% | 23.5% |
| Standard Deviation (Population) | 11.6% | 23.3% |
Similar Demographics by In Labor Force | Age 16-19
Demographics Similar to Immigrants from Ghana by In Labor Force | Age 16-19
In terms of in labor force | age 16-19, the demographic groups most similar to Immigrants from Ghana are Turkish (35.4%, a difference of 0.010%), Ghanaian (35.3%, a difference of 0.15%), Honduran (35.3%, a difference of 0.16%), Immigrants from Bahamas (35.5%, a difference of 0.19%), and Guatemalan (35.5%, a difference of 0.24%).
| Demographics | Rating | Rank | In Labor Force | Age 16-19 |
| Immigrants | South Eastern Asia | 10.8 /100 | #215 | Poor 35.6% |
| Dutch West Indians | 10.7 /100 | #216 | Poor 35.6% |
| Immigrants | Costa Rica | 10.7 /100 | #217 | Poor 35.6% |
| Sri Lankans | 9.8 /100 | #218 | Tragic 35.5% |
| Guatemalans | 8.6 /100 | #219 | Tragic 35.5% |
| Immigrants | Bahamas | 8.3 /100 | #220 | Tragic 35.5% |
| Turks | 7.3 /100 | #221 | Tragic 35.4% |
| Immigrants | Ghana | 7.3 /100 | #222 | Tragic 35.4% |
| Ghanaians | 6.5 /100 | #223 | Tragic 35.3% |
| Hondurans | 6.5 /100 | #224 | Tragic 35.3% |
| Immigrants | Belgium | 6.1 /100 | #225 | Tragic 35.3% |
| Immigrants | Guatemala | 5.7 /100 | #226 | Tragic 35.3% |
| Mongolians | 5.7 /100 | #227 | Tragic 35.3% |
| Immigrants | Senegal | 5.5 /100 | #228 | Tragic 35.3% |
| Immigrants | Lebanon | 5.0 /100 | #229 | Tragic 35.2% |
Demographics Similar to Spanish by In Labor Force | Age 16-19
In terms of in labor force | age 16-19, the demographic groups most similar to Spanish are Basque (39.3%, a difference of 0.020%), Shoshone (39.3%, a difference of 0.080%), Immigrants from Uganda (39.2%, a difference of 0.13%), Creek (39.1%, a difference of 0.28%), and Samoan (39.1%, a difference of 0.30%).
| Demographics | Rating | Rank | In Labor Force | Age 16-19 |
| Malaysians | 99.9 /100 | #76 | Exceptional 39.7% |
| Immigrants | Portugal | 99.9 /100 | #77 | Exceptional 39.7% |
| Austrians | 99.8 /100 | #78 | Exceptional 39.5% |
| Marshallese | 99.8 /100 | #79 | Exceptional 39.5% |
| Immigrants | Iraq | 99.8 /100 | #80 | Exceptional 39.4% |
| Shoshone | 99.7 /100 | #81 | Exceptional 39.3% |
| Basques | 99.7 /100 | #82 | Exceptional 39.3% |
| Spanish | 99.7 /100 | #83 | Exceptional 39.3% |
| Immigrants | Uganda | 99.7 /100 | #84 | Exceptional 39.2% |
| Creek | 99.6 /100 | #85 | Exceptional 39.1% |
| Samoans | 99.6 /100 | #86 | Exceptional 39.1% |
| Immigrants | Germany | 99.6 /100 | #87 | Exceptional 39.1% |
| Puget Sound Salish | 99.6 /100 | #88 | Exceptional 39.1% |
| Alaska Natives | 99.6 /100 | #89 | Exceptional 39.1% |
| Immigrants | Burma/Myanmar | 99.5 /100 | #90 | Exceptional 39.0% |