Immigrants from Ghana vs Nigerian In Labor Force | Age 16-19
COMPARE
Immigrants from Ghana
Nigerian
In Labor Force | Age 16-19
In Labor Force | Age 16-19 Comparison
Immigrants from Ghana
Nigerians
35.4%
IN LABOR FORCE | AGE 16-19
7.3/ 100
METRIC RATING
222nd/ 347
METRIC RANK
36.1%
IN LABOR FORCE | AGE 16-19
24.6/ 100
METRIC RATING
194th/ 347
METRIC RANK
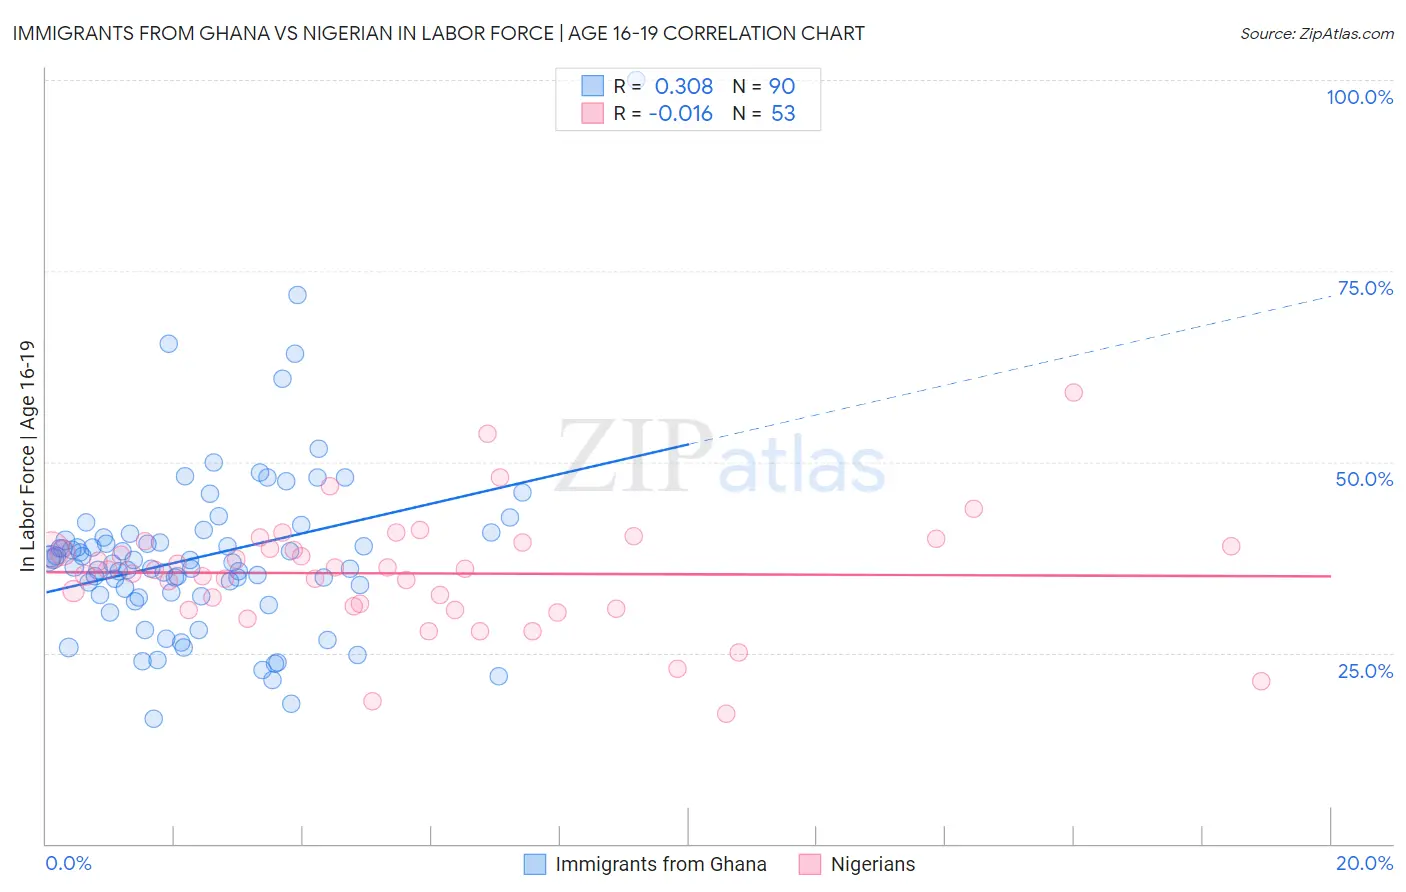
Immigrants from Ghana vs Nigerian In Labor Force | Age 16-19 Correlation Chart
The statistical analysis conducted on geographies consisting of 199,826,706 people shows a mild positive correlation between the proportion of Immigrants from Ghana and labor force participation rate among population between the ages 16 and 19 in the United States with a correlation coefficient (R) of 0.308 and weighted average of 35.4%. Similarly, the statistical analysis conducted on geographies consisting of 332,555,349 people shows no correlation between the proportion of Nigerians and labor force participation rate among population between the ages 16 and 19 in the United States with a correlation coefficient (R) of -0.016 and weighted average of 36.1%, a difference of 1.9%.
In Labor Force | Age 16-19 Correlation Summary
| Measurement | Immigrants from Ghana | Nigerian |
| Minimum | 16.3% | 17.0% |
| Maximum | 100.0% | 59.1% |
| Range | 83.7% | 42.1% |
| Mean | 37.7% | 35.4% |
| Median | 36.7% | 35.9% |
| Interquartile 25% (IQ1) | 32.5% | 31.0% |
| Interquartile 75% (IQ3) | 40.1% | 39.2% |
| Interquartile Range (IQR) | 7.5% | 8.2% |
| Standard Deviation (Sample) | 11.6% | 7.5% |
| Standard Deviation (Population) | 11.6% | 7.5% |
Similar Demographics by In Labor Force | Age 16-19
Demographics Similar to Immigrants from Ghana by In Labor Force | Age 16-19
In terms of in labor force | age 16-19, the demographic groups most similar to Immigrants from Ghana are Turkish (35.4%, a difference of 0.010%), Ghanaian (35.3%, a difference of 0.15%), Honduran (35.3%, a difference of 0.16%), Immigrants from Bahamas (35.5%, a difference of 0.19%), and Guatemalan (35.5%, a difference of 0.24%).
| Demographics | Rating | Rank | In Labor Force | Age 16-19 |
| Immigrants | South Eastern Asia | 10.8 /100 | #215 | Poor 35.6% |
| Dutch West Indians | 10.7 /100 | #216 | Poor 35.6% |
| Immigrants | Costa Rica | 10.7 /100 | #217 | Poor 35.6% |
| Sri Lankans | 9.8 /100 | #218 | Tragic 35.5% |
| Guatemalans | 8.6 /100 | #219 | Tragic 35.5% |
| Immigrants | Bahamas | 8.3 /100 | #220 | Tragic 35.5% |
| Turks | 7.3 /100 | #221 | Tragic 35.4% |
| Immigrants | Ghana | 7.3 /100 | #222 | Tragic 35.4% |
| Ghanaians | 6.5 /100 | #223 | Tragic 35.3% |
| Hondurans | 6.5 /100 | #224 | Tragic 35.3% |
| Immigrants | Belgium | 6.1 /100 | #225 | Tragic 35.3% |
| Immigrants | Guatemala | 5.7 /100 | #226 | Tragic 35.3% |
| Mongolians | 5.7 /100 | #227 | Tragic 35.3% |
| Immigrants | Senegal | 5.5 /100 | #228 | Tragic 35.3% |
| Immigrants | Lebanon | 5.0 /100 | #229 | Tragic 35.2% |
Demographics Similar to Nigerians by In Labor Force | Age 16-19
In terms of in labor force | age 16-19, the demographic groups most similar to Nigerians are Immigrants from Denmark (36.1%, a difference of 0.030%), Afghan (36.1%, a difference of 0.070%), Bolivian (36.0%, a difference of 0.090%), Immigrants from Croatia (36.1%, a difference of 0.19%), and Panamanian (36.1%, a difference of 0.26%).
| Demographics | Rating | Rank | In Labor Force | Age 16-19 |
| Immigrants | Afghanistan | 34.0 /100 | #187 | Fair 36.3% |
| Immigrants | Europe | 31.8 /100 | #188 | Fair 36.2% |
| Immigrants | Hungary | 28.8 /100 | #189 | Fair 36.2% |
| Panamanians | 28.6 /100 | #190 | Fair 36.1% |
| Immigrants | Croatia | 27.5 /100 | #191 | Fair 36.1% |
| Afghans | 25.7 /100 | #192 | Fair 36.1% |
| Immigrants | Denmark | 25.0 /100 | #193 | Fair 36.1% |
| Nigerians | 24.6 /100 | #194 | Fair 36.1% |
| Bolivians | 23.3 /100 | #195 | Fair 36.0% |
| Mexican American Indians | 21.1 /100 | #196 | Fair 36.0% |
| Immigrants | Serbia | 21.0 /100 | #197 | Fair 36.0% |
| Immigrants | Northern Africa | 19.9 /100 | #198 | Poor 35.9% |
| Immigrants | Norway | 19.8 /100 | #199 | Poor 35.9% |
| Immigrants | Sweden | 18.8 /100 | #200 | Poor 35.9% |
| Alsatians | 17.5 /100 | #201 | Poor 35.9% |