Immigrants from Fiji vs Pueblo In Labor Force | Age 30-34
COMPARE
Immigrants from Fiji
Pueblo
In Labor Force | Age 30-34
In Labor Force | Age 30-34 Comparison
Immigrants from Fiji
Pueblo
83.4%
IN LABOR FORCE | AGE 30-34
0.0/ 100
METRIC RATING
279th/ 347
METRIC RANK
80.0%
IN LABOR FORCE | AGE 30-34
0.0/ 100
METRIC RATING
330th/ 347
METRIC RANK
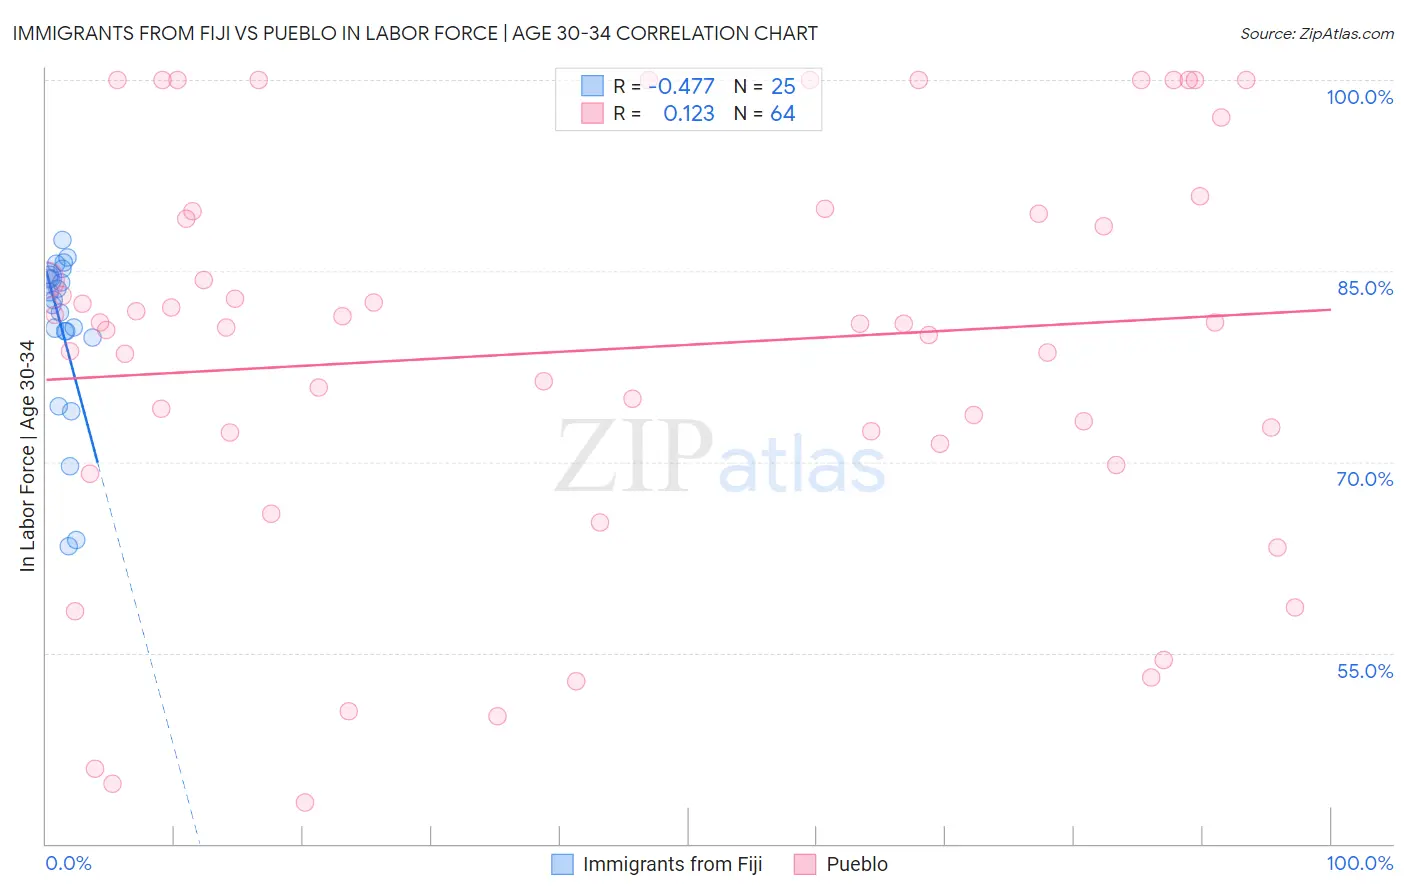
Immigrants from Fiji vs Pueblo In Labor Force | Age 30-34 Correlation Chart
The statistical analysis conducted on geographies consisting of 93,755,407 people shows a moderate negative correlation between the proportion of Immigrants from Fiji and labor force participation rate among population between the ages 30 and 34 in the United States with a correlation coefficient (R) of -0.477 and weighted average of 83.4%. Similarly, the statistical analysis conducted on geographies consisting of 120,059,209 people shows a poor positive correlation between the proportion of Pueblo and labor force participation rate among population between the ages 30 and 34 in the United States with a correlation coefficient (R) of 0.123 and weighted average of 80.0%, a difference of 4.2%.
In Labor Force | Age 30-34 Correlation Summary
| Measurement | Immigrants from Fiji | Pueblo |
| Minimum | 63.4% | 43.2% |
| Maximum | 87.5% | 100.0% |
| Range | 24.1% | 56.8% |
| Mean | 80.5% | 78.8% |
| Median | 82.7% | 80.9% |
| Interquartile 25% (IQ1) | 80.0% | 71.9% |
| Interquartile 75% (IQ3) | 84.6% | 89.6% |
| Interquartile Range (IQR) | 4.6% | 17.8% |
| Standard Deviation (Sample) | 6.5% | 15.7% |
| Standard Deviation (Population) | 6.4% | 15.6% |
Similar Demographics by In Labor Force | Age 30-34
Demographics Similar to Immigrants from Fiji by In Labor Force | Age 30-34
In terms of in labor force | age 30-34, the demographic groups most similar to Immigrants from Fiji are Fijian (83.4%, a difference of 0.010%), African (83.4%, a difference of 0.030%), Delaware (83.5%, a difference of 0.070%), Tongan (83.5%, a difference of 0.080%), and Immigrants from Grenada (83.5%, a difference of 0.090%).
| Demographics | Rating | Rank | In Labor Force | Age 30-34 |
| Immigrants | Nonimmigrants | 0.0 /100 | #272 | Tragic 83.5% |
| Guamanians/Chamorros | 0.0 /100 | #273 | Tragic 83.5% |
| Belizeans | 0.0 /100 | #274 | Tragic 83.5% |
| Immigrants | Grenada | 0.0 /100 | #275 | Tragic 83.5% |
| Tongans | 0.0 /100 | #276 | Tragic 83.5% |
| Delaware | 0.0 /100 | #277 | Tragic 83.5% |
| Fijians | 0.0 /100 | #278 | Tragic 83.4% |
| Immigrants | Fiji | 0.0 /100 | #279 | Tragic 83.4% |
| Africans | 0.0 /100 | #280 | Tragic 83.4% |
| Samoans | 0.0 /100 | #281 | Tragic 83.3% |
| Mexican American Indians | 0.0 /100 | #282 | Tragic 83.2% |
| Assyrians/Chaldeans/Syriacs | 0.0 /100 | #283 | Tragic 83.2% |
| Immigrants | Belize | 0.0 /100 | #284 | Tragic 83.2% |
| Cree | 0.0 /100 | #285 | Tragic 83.2% |
| Immigrants | Latin America | 0.0 /100 | #286 | Tragic 83.1% |
Demographics Similar to Pueblo by In Labor Force | Age 30-34
In terms of in labor force | age 30-34, the demographic groups most similar to Pueblo are Houma (79.9%, a difference of 0.17%), Kiowa (79.8%, a difference of 0.28%), Creek (80.4%, a difference of 0.40%), Inupiat (79.7%, a difference of 0.40%), and Sioux (80.4%, a difference of 0.41%).
| Demographics | Rating | Rank | In Labor Force | Age 30-34 |
| Paiute | 0.0 /100 | #323 | Tragic 81.2% |
| Cheyenne | 0.0 /100 | #324 | Tragic 81.1% |
| Dutch West Indians | 0.0 /100 | #325 | Tragic 81.0% |
| Seminole | 0.0 /100 | #326 | Tragic 80.8% |
| Colville | 0.0 /100 | #327 | Tragic 80.7% |
| Sioux | 0.0 /100 | #328 | Tragic 80.4% |
| Creek | 0.0 /100 | #329 | Tragic 80.4% |
| Pueblo | 0.0 /100 | #330 | Tragic 80.0% |
| Houma | 0.0 /100 | #331 | Tragic 79.9% |
| Kiowa | 0.0 /100 | #332 | Tragic 79.8% |
| Inupiat | 0.0 /100 | #333 | Tragic 79.7% |
| Hopi | 0.0 /100 | #334 | Tragic 79.3% |
| Marshallese | 0.0 /100 | #335 | Tragic 79.2% |
| Natives/Alaskans | 0.0 /100 | #336 | Tragic 79.2% |
| Yakama | 0.0 /100 | #337 | Tragic 79.1% |