Immigrants from Fiji vs Immigrants from Denmark Median Family Income
COMPARE
Immigrants from Fiji
Immigrants from Denmark
Median Family Income
Median Family Income Comparison
Immigrants from Fiji
Immigrants from Denmark
$106,544
MEDIAN FAMILY INCOME
87.8/ 100
METRIC RATING
132nd/ 347
METRIC RANK
$120,445
MEDIAN FAMILY INCOME
100.0/ 100
METRIC RATING
28th/ 347
METRIC RANK
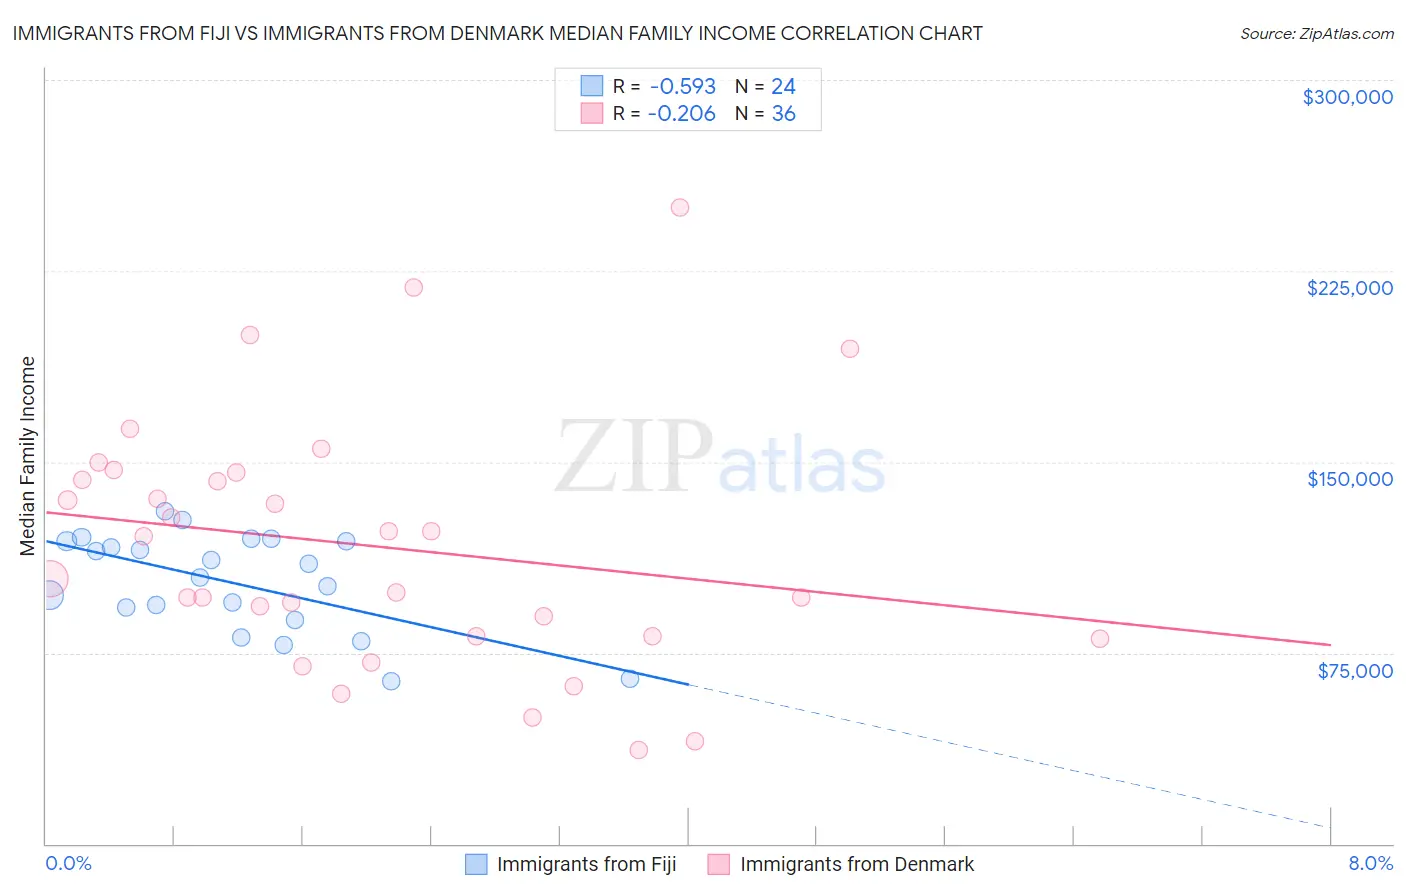
Immigrants from Fiji vs Immigrants from Denmark Median Family Income Correlation Chart
The statistical analysis conducted on geographies consisting of 93,753,108 people shows a substantial negative correlation between the proportion of Immigrants from Fiji and median family income in the United States with a correlation coefficient (R) of -0.593 and weighted average of $106,544. Similarly, the statistical analysis conducted on geographies consisting of 136,397,640 people shows a weak negative correlation between the proportion of Immigrants from Denmark and median family income in the United States with a correlation coefficient (R) of -0.206 and weighted average of $120,445, a difference of 13.1%.
Median Family Income Correlation Summary
| Measurement | Immigrants from Fiji | Immigrants from Denmark |
| Minimum | $63,924 | $36,611 |
| Maximum | $130,465 | $250,001 |
| Range | $66,540 | $213,390 |
| Mean | $102,660 | $116,902 |
| Median | $107,335 | $112,401 |
| Interquartile 25% (IQ1) | $90,188 | $81,504 |
| Interquartile 75% (IQ3) | $118,761 | $144,309 |
| Interquartile Range (IQR) | $28,573 | $62,805 |
| Standard Deviation (Sample) | $19,212 | $49,223 |
| Standard Deviation (Population) | $18,807 | $48,535 |
Similar Demographics by Median Family Income
Demographics Similar to Immigrants from Fiji by Median Family Income
In terms of median family income, the demographic groups most similar to Immigrants from Fiji are Ugandan ($106,541, a difference of 0.0%), Canadian ($106,597, a difference of 0.050%), Immigrants from Oceania ($106,453, a difference of 0.090%), Portuguese ($106,286, a difference of 0.24%), and Immigrants from South Eastern Asia ($106,252, a difference of 0.27%).
| Demographics | Rating | Rank | Median Family Income |
| Taiwanese | 91.4 /100 | #125 | Exceptional $107,295 |
| Serbians | 90.8 /100 | #126 | Exceptional $107,157 |
| Lebanese | 90.5 /100 | #127 | Exceptional $107,086 |
| Immigrants | Ethiopia | 90.0 /100 | #128 | Excellent $106,969 |
| Arabs | 89.9 /100 | #129 | Excellent $106,952 |
| Brazilians | 89.8 /100 | #130 | Excellent $106,942 |
| Canadians | 88.1 /100 | #131 | Excellent $106,597 |
| Immigrants | Fiji | 87.8 /100 | #132 | Excellent $106,544 |
| Ugandans | 87.8 /100 | #133 | Excellent $106,541 |
| Immigrants | Oceania | 87.3 /100 | #134 | Excellent $106,453 |
| Portuguese | 86.3 /100 | #135 | Excellent $106,286 |
| Immigrants | South Eastern Asia | 86.1 /100 | #136 | Excellent $106,252 |
| Immigrants | Uganda | 85.7 /100 | #137 | Excellent $106,188 |
| Immigrants | Vietnam | 85.7 /100 | #138 | Excellent $106,186 |
| Luxembourgers | 85.7 /100 | #139 | Excellent $106,183 |
Demographics Similar to Immigrants from Denmark by Median Family Income
In terms of median family income, the demographic groups most similar to Immigrants from Denmark are Russian ($120,487, a difference of 0.040%), Latvian ($120,301, a difference of 0.12%), Immigrants from Sri Lanka ($120,263, a difference of 0.15%), Immigrants from Switzerland ($120,726, a difference of 0.23%), and Immigrants from France ($120,076, a difference of 0.31%).
| Demographics | Rating | Rank | Median Family Income |
| Immigrants | Korea | 100.0 /100 | #21 | Exceptional $122,800 |
| Immigrants | Sweden | 100.0 /100 | #22 | Exceptional $122,765 |
| Immigrants | Japan | 100.0 /100 | #23 | Exceptional $122,764 |
| Immigrants | Northern Europe | 100.0 /100 | #24 | Exceptional $121,840 |
| Turks | 100.0 /100 | #25 | Exceptional $121,202 |
| Immigrants | Switzerland | 100.0 /100 | #26 | Exceptional $120,726 |
| Russians | 100.0 /100 | #27 | Exceptional $120,487 |
| Immigrants | Denmark | 100.0 /100 | #28 | Exceptional $120,445 |
| Latvians | 100.0 /100 | #29 | Exceptional $120,301 |
| Immigrants | Sri Lanka | 100.0 /100 | #30 | Exceptional $120,263 |
| Immigrants | France | 100.0 /100 | #31 | Exceptional $120,076 |
| Asians | 100.0 /100 | #32 | Exceptional $119,955 |
| Bhutanese | 100.0 /100 | #33 | Exceptional $119,800 |
| Bolivians | 100.0 /100 | #34 | Exceptional $119,479 |
| Soviet Union | 100.0 /100 | #35 | Exceptional $119,262 |