Native Hawaiian vs Colville In Labor Force | Age 45-54
COMPARE
Native Hawaiian
Colville
In Labor Force | Age 45-54
In Labor Force | Age 45-54 Comparison
Native Hawaiians
Colville
82.3%
IN LABOR FORCE | AGE 45-54
8.5/ 100
METRIC RATING
208th/ 347
METRIC RANK
79.5%
IN LABOR FORCE | AGE 45-54
0.0/ 100
METRIC RATING
313th/ 347
METRIC RANK
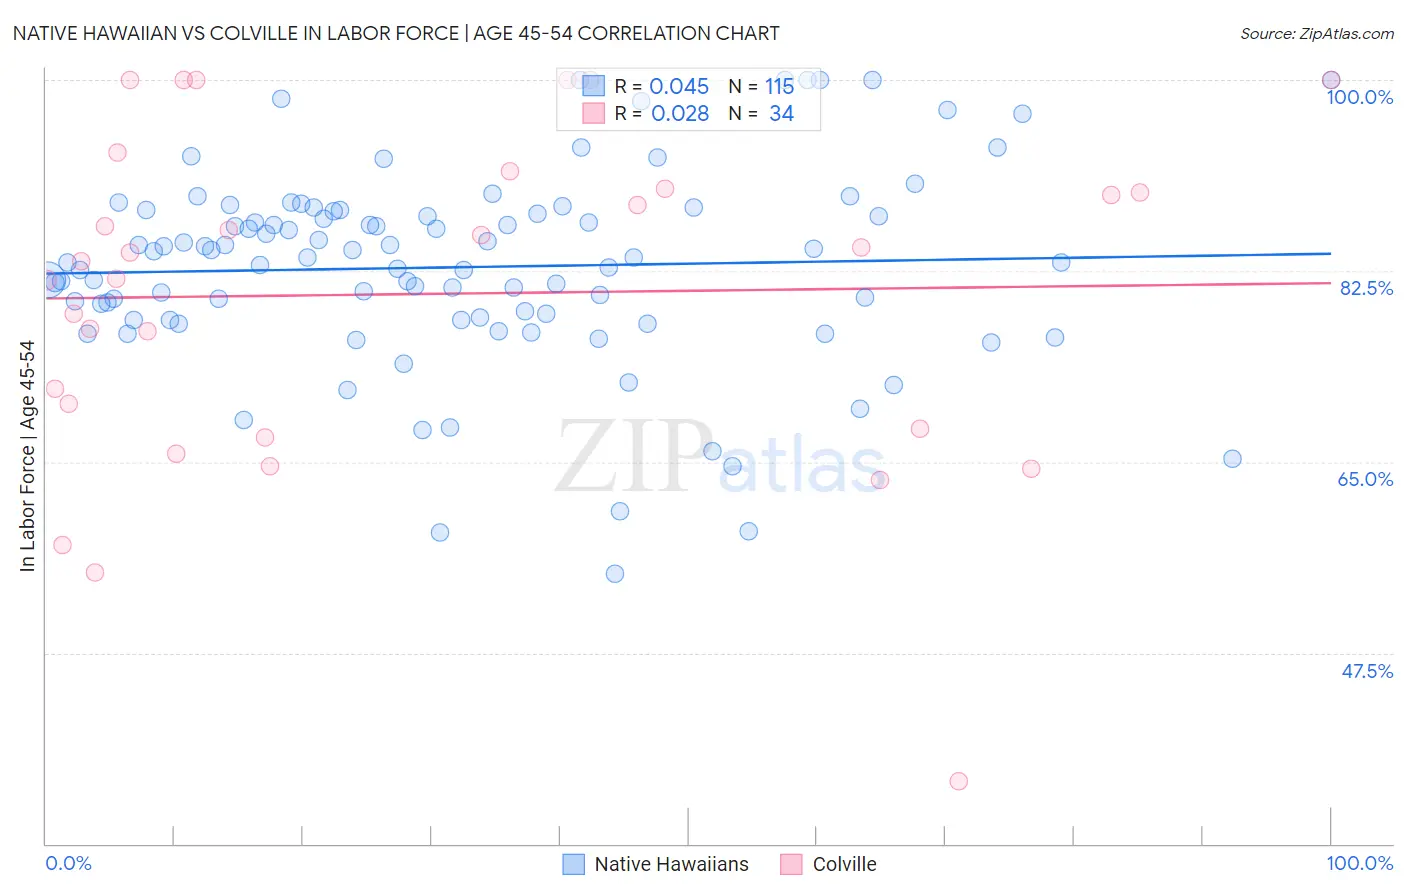
Native Hawaiian vs Colville In Labor Force | Age 45-54 Correlation Chart
The statistical analysis conducted on geographies consisting of 331,883,944 people shows no correlation between the proportion of Native Hawaiians and labor force participation rate among population between the ages 45 and 54 in the United States with a correlation coefficient (R) of 0.045 and weighted average of 82.3%. Similarly, the statistical analysis conducted on geographies consisting of 34,682,093 people shows no correlation between the proportion of Colville and labor force participation rate among population between the ages 45 and 54 in the United States with a correlation coefficient (R) of 0.028 and weighted average of 79.5%, a difference of 3.6%.
In Labor Force | Age 45-54 Correlation Summary
| Measurement | Native Hawaiian | Colville |
| Minimum | 54.8% | 35.7% |
| Maximum | 100.0% | 100.0% |
| Range | 45.2% | 64.3% |
| Mean | 82.8% | 80.4% |
| Median | 83.7% | 83.8% |
| Interquartile 25% (IQ1) | 78.0% | 68.0% |
| Interquartile 75% (IQ3) | 88.0% | 90.0% |
| Interquartile Range (IQR) | 10.0% | 22.0% |
| Standard Deviation (Sample) | 9.0% | 15.4% |
| Standard Deviation (Population) | 9.0% | 15.1% |
Similar Demographics by In Labor Force | Age 45-54
Demographics Similar to Native Hawaiians by In Labor Force | Age 45-54
In terms of in labor force | age 45-54, the demographic groups most similar to Native Hawaiians are Immigrants from Cabo Verde (82.3%, a difference of 0.0%), Welsh (82.3%, a difference of 0.020%), Senegalese (82.4%, a difference of 0.030%), Immigrants from Lebanon (82.3%, a difference of 0.030%), and Immigrants from Bahamas (82.3%, a difference of 0.040%).
| Demographics | Rating | Rank | In Labor Force | Age 45-54 |
| Canadians | 15.1 /100 | #201 | Poor 82.4% |
| Immigrants | Western Asia | 14.9 /100 | #202 | Poor 82.4% |
| Arabs | 11.6 /100 | #203 | Poor 82.4% |
| Immigrants | Western Europe | 10.9 /100 | #204 | Poor 82.4% |
| Senegalese | 9.5 /100 | #205 | Tragic 82.4% |
| Welsh | 9.2 /100 | #206 | Tragic 82.3% |
| Immigrants | Cabo Verde | 8.6 /100 | #207 | Tragic 82.3% |
| Native Hawaiians | 8.5 /100 | #208 | Tragic 82.3% |
| Immigrants | Lebanon | 7.4 /100 | #209 | Tragic 82.3% |
| Immigrants | Bahamas | 7.1 /100 | #210 | Tragic 82.3% |
| Immigrants | Syria | 6.6 /100 | #211 | Tragic 82.3% |
| Ecuadorians | 6.3 /100 | #212 | Tragic 82.3% |
| Immigrants | Uzbekistan | 5.8 /100 | #213 | Tragic 82.3% |
| Immigrants | Panama | 5.6 /100 | #214 | Tragic 82.2% |
| Iraqis | 5.6 /100 | #215 | Tragic 82.2% |
Demographics Similar to Colville by In Labor Force | Age 45-54
In terms of in labor force | age 45-54, the demographic groups most similar to Colville are Ottawa (79.5%, a difference of 0.040%), Black/African American (79.3%, a difference of 0.17%), Immigrants from Mexico (79.7%, a difference of 0.24%), Shoshone (79.3%, a difference of 0.26%), and Mexican (79.8%, a difference of 0.39%).
| Demographics | Rating | Rank | In Labor Force | Age 45-54 |
| Spanish Americans | 0.0 /100 | #306 | Tragic 80.1% |
| Blackfeet | 0.0 /100 | #307 | Tragic 80.0% |
| Central American Indians | 0.0 /100 | #308 | Tragic 80.0% |
| Potawatomi | 0.0 /100 | #309 | Tragic 80.0% |
| Inupiat | 0.0 /100 | #310 | Tragic 79.9% |
| Mexicans | 0.0 /100 | #311 | Tragic 79.8% |
| Immigrants | Mexico | 0.0 /100 | #312 | Tragic 79.7% |
| Colville | 0.0 /100 | #313 | Tragic 79.5% |
| Ottawa | 0.0 /100 | #314 | Tragic 79.5% |
| Blacks/African Americans | 0.0 /100 | #315 | Tragic 79.3% |
| Shoshone | 0.0 /100 | #316 | Tragic 79.3% |
| Comanche | 0.0 /100 | #317 | Tragic 79.2% |
| Chickasaw | 0.0 /100 | #318 | Tragic 79.0% |
| Cherokee | 0.0 /100 | #319 | Tragic 79.0% |
| Yaqui | 0.0 /100 | #320 | Tragic 78.9% |