Immigrants from Nepal vs Colville In Labor Force | Age 45-54
COMPARE
Immigrants from Nepal
Colville
In Labor Force | Age 45-54
In Labor Force | Age 45-54 Comparison
Immigrants from Nepal
Colville
84.0%
IN LABOR FORCE | AGE 45-54
99.9/ 100
METRIC RATING
16th/ 347
METRIC RANK
79.5%
IN LABOR FORCE | AGE 45-54
0.0/ 100
METRIC RATING
313th/ 347
METRIC RANK
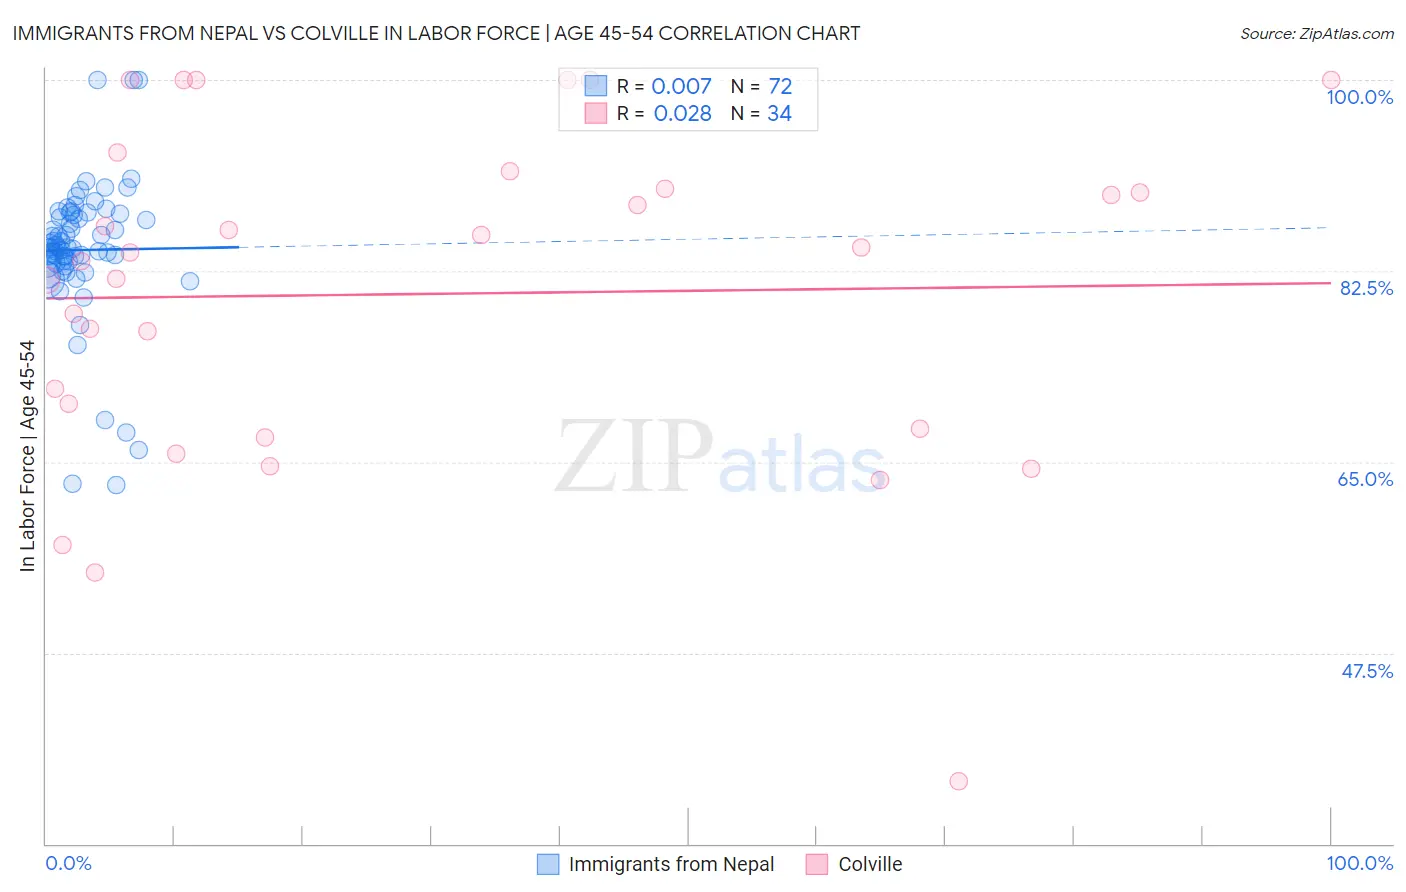
Immigrants from Nepal vs Colville In Labor Force | Age 45-54 Correlation Chart
The statistical analysis conducted on geographies consisting of 186,685,314 people shows no correlation between the proportion of Immigrants from Nepal and labor force participation rate among population between the ages 45 and 54 in the United States with a correlation coefficient (R) of 0.007 and weighted average of 84.0%. Similarly, the statistical analysis conducted on geographies consisting of 34,682,093 people shows no correlation between the proportion of Colville and labor force participation rate among population between the ages 45 and 54 in the United States with a correlation coefficient (R) of 0.028 and weighted average of 79.5%, a difference of 5.7%.
In Labor Force | Age 45-54 Correlation Summary
| Measurement | Immigrants from Nepal | Colville |
| Minimum | 62.9% | 35.7% |
| Maximum | 100.0% | 100.0% |
| Range | 37.1% | 64.3% |
| Mean | 84.4% | 80.4% |
| Median | 84.6% | 83.8% |
| Interquartile 25% (IQ1) | 83.2% | 68.0% |
| Interquartile 75% (IQ3) | 87.6% | 90.0% |
| Interquartile Range (IQR) | 4.5% | 22.0% |
| Standard Deviation (Sample) | 6.6% | 15.4% |
| Standard Deviation (Population) | 6.6% | 15.1% |
Similar Demographics by In Labor Force | Age 45-54
Demographics Similar to Immigrants from Nepal by In Labor Force | Age 45-54
In terms of in labor force | age 45-54, the demographic groups most similar to Immigrants from Nepal are Cypriot (84.1%, a difference of 0.020%), Zimbabwean (84.0%, a difference of 0.020%), Immigrants from South Central Asia (84.0%, a difference of 0.030%), Cambodian (84.1%, a difference of 0.080%), and Chinese (84.1%, a difference of 0.11%).
| Demographics | Rating | Rank | In Labor Force | Age 45-54 |
| Immigrants | Sierra Leone | 100.0 /100 | #9 | Exceptional 84.4% |
| Norwegians | 100.0 /100 | #10 | Exceptional 84.4% |
| Thais | 100.0 /100 | #11 | Exceptional 84.3% |
| Bulgarians | 100.0 /100 | #12 | Exceptional 84.2% |
| Chinese | 99.9 /100 | #13 | Exceptional 84.1% |
| Cambodians | 99.9 /100 | #14 | Exceptional 84.1% |
| Cypriots | 99.9 /100 | #15 | Exceptional 84.1% |
| Immigrants | Nepal | 99.9 /100 | #16 | Exceptional 84.0% |
| Zimbabweans | 99.9 /100 | #17 | Exceptional 84.0% |
| Immigrants | South Central Asia | 99.9 /100 | #18 | Exceptional 84.0% |
| Czechs | 99.8 /100 | #19 | Exceptional 83.9% |
| Immigrants | Eastern Africa | 99.8 /100 | #20 | Exceptional 83.9% |
| Immigrants | Sri Lanka | 99.8 /100 | #21 | Exceptional 83.9% |
| Immigrants | Ireland | 99.8 /100 | #22 | Exceptional 83.9% |
| Tlingit-Haida | 99.8 /100 | #23 | Exceptional 83.9% |
Demographics Similar to Colville by In Labor Force | Age 45-54
In terms of in labor force | age 45-54, the demographic groups most similar to Colville are Ottawa (79.5%, a difference of 0.040%), Black/African American (79.3%, a difference of 0.17%), Immigrants from Mexico (79.7%, a difference of 0.24%), Shoshone (79.3%, a difference of 0.26%), and Mexican (79.8%, a difference of 0.39%).
| Demographics | Rating | Rank | In Labor Force | Age 45-54 |
| Spanish Americans | 0.0 /100 | #306 | Tragic 80.1% |
| Blackfeet | 0.0 /100 | #307 | Tragic 80.0% |
| Central American Indians | 0.0 /100 | #308 | Tragic 80.0% |
| Potawatomi | 0.0 /100 | #309 | Tragic 80.0% |
| Inupiat | 0.0 /100 | #310 | Tragic 79.9% |
| Mexicans | 0.0 /100 | #311 | Tragic 79.8% |
| Immigrants | Mexico | 0.0 /100 | #312 | Tragic 79.7% |
| Colville | 0.0 /100 | #313 | Tragic 79.5% |
| Ottawa | 0.0 /100 | #314 | Tragic 79.5% |
| Blacks/African Americans | 0.0 /100 | #315 | Tragic 79.3% |
| Shoshone | 0.0 /100 | #316 | Tragic 79.3% |
| Comanche | 0.0 /100 | #317 | Tragic 79.2% |
| Chickasaw | 0.0 /100 | #318 | Tragic 79.0% |
| Cherokee | 0.0 /100 | #319 | Tragic 79.0% |
| Yaqui | 0.0 /100 | #320 | Tragic 78.9% |