Immigrants from Ecuador vs Immigrants from Kazakhstan In Labor Force | Age 20-64
COMPARE
Immigrants from Ecuador
Immigrants from Kazakhstan
In Labor Force | Age 20-64
In Labor Force | Age 20-64 Comparison
Immigrants from Ecuador
Immigrants from Kazakhstan
79.3%
IN LABOR FORCE | AGE 20-64
16.9/ 100
METRIC RATING
206th/ 347
METRIC RANK
79.7%
IN LABOR FORCE | AGE 20-64
69.5/ 100
METRIC RATING
153rd/ 347
METRIC RANK
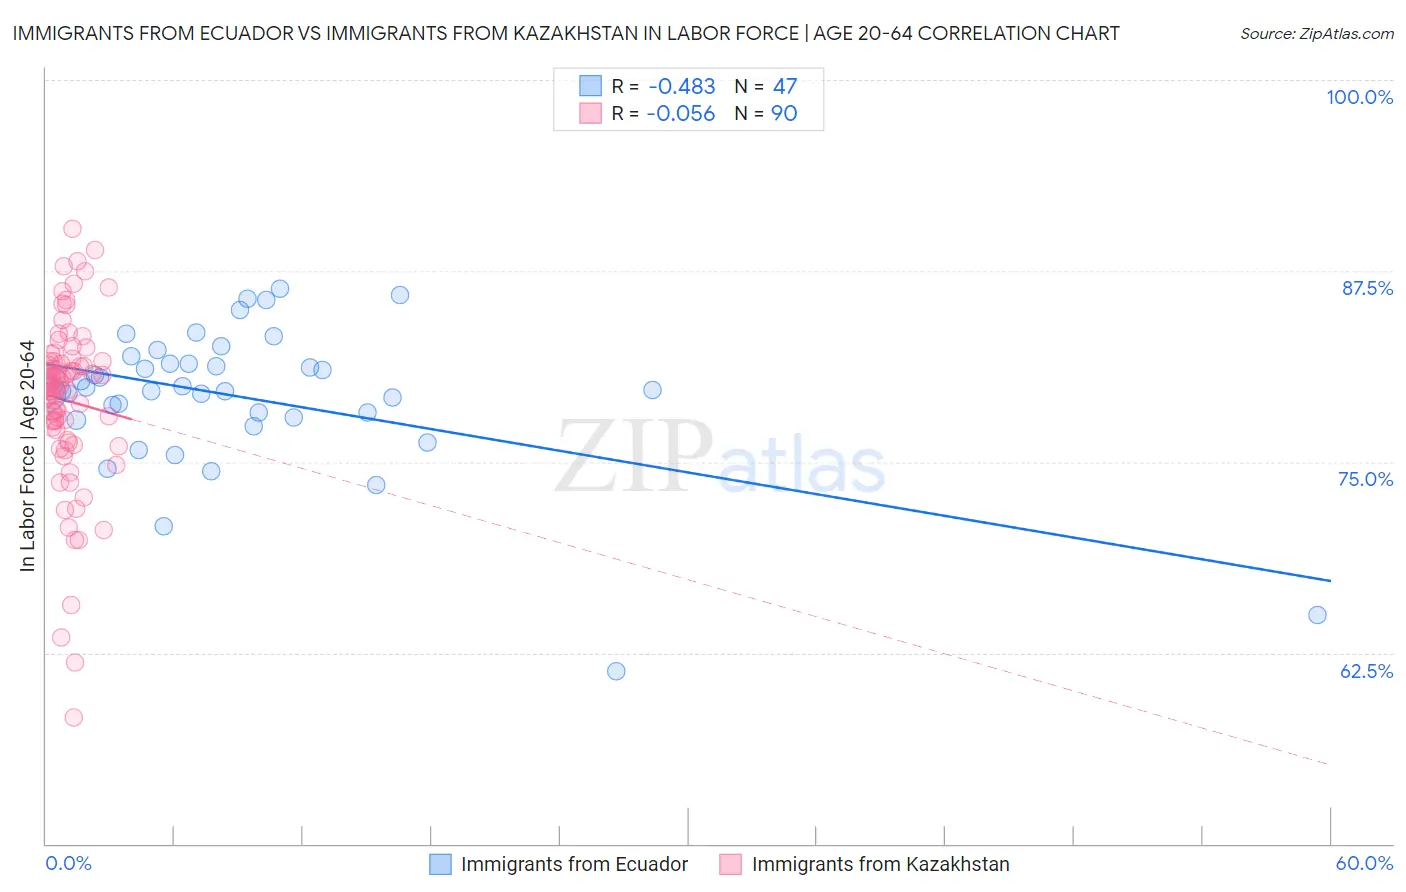
Immigrants from Ecuador vs Immigrants from Kazakhstan In Labor Force | Age 20-64 Correlation Chart
The statistical analysis conducted on geographies consisting of 271,016,720 people shows a moderate negative correlation between the proportion of Immigrants from Ecuador and labor force participation rate among population between the ages 20 and 64 in the United States with a correlation coefficient (R) of -0.483 and weighted average of 79.3%. Similarly, the statistical analysis conducted on geographies consisting of 124,438,593 people shows a slight negative correlation between the proportion of Immigrants from Kazakhstan and labor force participation rate among population between the ages 20 and 64 in the United States with a correlation coefficient (R) of -0.056 and weighted average of 79.7%, a difference of 0.49%.
In Labor Force | Age 20-64 Correlation Summary
| Measurement | Immigrants from Ecuador | Immigrants from Kazakhstan |
| Minimum | 61.3% | 58.3% |
| Maximum | 86.4% | 90.3% |
| Range | 25.1% | 32.0% |
| Mean | 79.3% | 79.0% |
| Median | 79.7% | 80.0% |
| Interquartile 25% (IQ1) | 77.9% | 77.1% |
| Interquartile 75% (IQ3) | 81.4% | 81.6% |
| Interquartile Range (IQR) | 3.5% | 4.5% |
| Standard Deviation (Sample) | 4.8% | 5.6% |
| Standard Deviation (Population) | 4.7% | 5.5% |
Similar Demographics by In Labor Force | Age 20-64
Demographics Similar to Immigrants from Ecuador by In Labor Force | Age 20-64
In terms of in labor force | age 20-64, the demographic groups most similar to Immigrants from Ecuador are Subsaharan African (79.3%, a difference of 0.0%), Iraqi (79.3%, a difference of 0.010%), Immigrants from Cambodia (79.3%, a difference of 0.010%), Immigrants from Congo (79.3%, a difference of 0.010%), and British (79.3%, a difference of 0.010%).
| Demographics | Rating | Rank | In Labor Force | Age 20-64 |
| Dutch | 20.2 /100 | #199 | Fair 79.3% |
| Immigrants | Oceania | 19.1 /100 | #200 | Poor 79.3% |
| Immigrants | Nicaragua | 19.0 /100 | #201 | Poor 79.3% |
| Nicaraguans | 18.3 /100 | #202 | Poor 79.3% |
| Iraqis | 17.7 /100 | #203 | Poor 79.3% |
| Immigrants | Cambodia | 17.6 /100 | #204 | Poor 79.3% |
| Immigrants | Congo | 17.5 /100 | #205 | Poor 79.3% |
| Immigrants | Ecuador | 16.9 /100 | #206 | Poor 79.3% |
| Sub-Saharan Africans | 16.5 /100 | #207 | Poor 79.3% |
| British | 16.5 /100 | #208 | Poor 79.3% |
| Bangladeshis | 16.4 /100 | #209 | Poor 79.3% |
| Haitians | 16.1 /100 | #210 | Poor 79.3% |
| Europeans | 15.3 /100 | #211 | Poor 79.3% |
| Irish | 13.2 /100 | #212 | Poor 79.3% |
| Immigrants | Portugal | 12.8 /100 | #213 | Poor 79.3% |
Demographics Similar to Immigrants from Kazakhstan by In Labor Force | Age 20-64
In terms of in labor force | age 20-64, the demographic groups most similar to Immigrants from Kazakhstan are New Zealander (79.7%, a difference of 0.0%), Immigrants from South Africa (79.7%, a difference of 0.0%), Senegalese (79.7%, a difference of 0.0%), Immigrants from China (79.7%, a difference of 0.0%), and Scandinavian (79.7%, a difference of 0.020%).
| Demographics | Rating | Rank | In Labor Force | Age 20-64 |
| Immigrants | Southern Europe | 78.9 /100 | #146 | Good 79.8% |
| Immigrants | Philippines | 78.0 /100 | #147 | Good 79.8% |
| Romanians | 77.6 /100 | #148 | Good 79.8% |
| Icelanders | 75.1 /100 | #149 | Good 79.7% |
| Costa Ricans | 72.4 /100 | #150 | Good 79.7% |
| Scandinavians | 72.0 /100 | #151 | Good 79.7% |
| Immigrants | Northern Europe | 72.0 /100 | #152 | Good 79.7% |
| Immigrants | Kazakhstan | 69.5 /100 | #153 | Good 79.7% |
| New Zealanders | 69.4 /100 | #154 | Good 79.7% |
| Immigrants | South Africa | 69.2 /100 | #155 | Good 79.7% |
| Senegalese | 69.1 /100 | #156 | Good 79.7% |
| Immigrants | China | 69.1 /100 | #157 | Good 79.7% |
| Austrians | 67.6 /100 | #158 | Good 79.7% |
| Immigrants | Cuba | 66.7 /100 | #159 | Good 79.7% |
| Moroccans | 66.7 /100 | #160 | Good 79.7% |