Immigrants from Eastern Europe vs Bulgarian In Labor Force | Age 25-29
COMPARE
Immigrants from Eastern Europe
Bulgarian
In Labor Force | Age 25-29
In Labor Force | Age 25-29 Comparison
Immigrants from Eastern Europe
Bulgarians
85.2%
IN LABOR FORCE | AGE 25-29
96.8/ 100
METRIC RATING
84th/ 347
METRIC RANK
86.0%
IN LABOR FORCE | AGE 25-29
100.0/ 100
METRIC RATING
18th/ 347
METRIC RANK
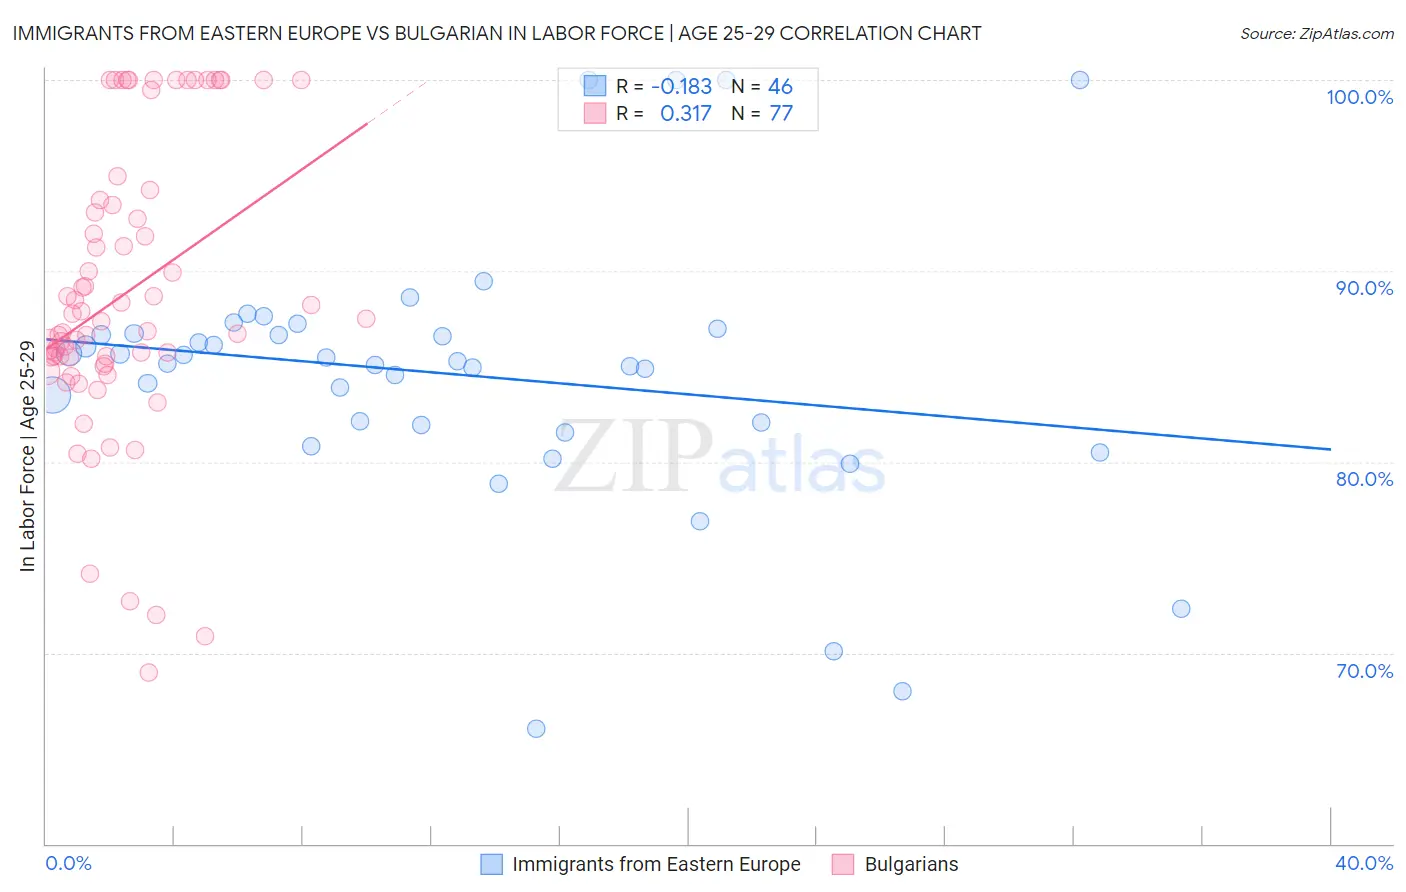
Immigrants from Eastern Europe vs Bulgarian In Labor Force | Age 25-29 Correlation Chart
The statistical analysis conducted on geographies consisting of 475,521,938 people shows a poor negative correlation between the proportion of Immigrants from Eastern Europe and labor force participation rate among population between the ages 25 and 29 in the United States with a correlation coefficient (R) of -0.183 and weighted average of 85.2%. Similarly, the statistical analysis conducted on geographies consisting of 205,601,422 people shows a mild positive correlation between the proportion of Bulgarians and labor force participation rate among population between the ages 25 and 29 in the United States with a correlation coefficient (R) of 0.317 and weighted average of 86.0%, a difference of 0.98%.
In Labor Force | Age 25-29 Correlation Summary
| Measurement | Immigrants from Eastern Europe | Bulgarian |
| Minimum | 66.0% | 69.0% |
| Maximum | 100.0% | 100.0% |
| Range | 34.0% | 31.0% |
| Mean | 84.6% | 88.8% |
| Median | 85.2% | 87.3% |
| Interquartile 25% (IQ1) | 81.9% | 85.3% |
| Interquartile 75% (IQ3) | 86.7% | 93.6% |
| Interquartile Range (IQR) | 4.8% | 8.3% |
| Standard Deviation (Sample) | 7.0% | 7.5% |
| Standard Deviation (Population) | 7.0% | 7.5% |
Similar Demographics by In Labor Force | Age 25-29
Demographics Similar to Immigrants from Eastern Europe by In Labor Force | Age 25-29
In terms of in labor force | age 25-29, the demographic groups most similar to Immigrants from Eastern Europe are Immigrants from Europe (85.2%, a difference of 0.0%), Immigrants from Africa (85.2%, a difference of 0.0%), Okinawan (85.2%, a difference of 0.010%), Ukrainian (85.2%, a difference of 0.010%), and French Canadian (85.2%, a difference of 0.010%).
| Demographics | Rating | Rank | In Labor Force | Age 25-29 |
| Immigrants | South Central Asia | 97.9 /100 | #77 | Exceptional 85.2% |
| Immigrants | Egypt | 97.7 /100 | #78 | Exceptional 85.2% |
| Immigrants | Northern Africa | 97.6 /100 | #79 | Exceptional 85.2% |
| Immigrants | Zimbabwe | 97.6 /100 | #80 | Exceptional 85.2% |
| Immigrants | Northern Europe | 97.2 /100 | #81 | Exceptional 85.2% |
| Okinawans | 97.0 /100 | #82 | Exceptional 85.2% |
| Immigrants | Europe | 96.8 /100 | #83 | Exceptional 85.2% |
| Immigrants | Eastern Europe | 96.8 /100 | #84 | Exceptional 85.2% |
| Immigrants | Africa | 96.7 /100 | #85 | Exceptional 85.2% |
| Ukrainians | 96.7 /100 | #86 | Exceptional 85.2% |
| French Canadians | 96.5 /100 | #87 | Exceptional 85.2% |
| Immigrants | Croatia | 96.4 /100 | #88 | Exceptional 85.2% |
| Immigrants | France | 96.3 /100 | #89 | Exceptional 85.2% |
| Burmese | 95.9 /100 | #90 | Exceptional 85.1% |
| Immigrants | Moldova | 95.8 /100 | #91 | Exceptional 85.1% |
Demographics Similar to Bulgarians by In Labor Force | Age 25-29
In terms of in labor force | age 25-29, the demographic groups most similar to Bulgarians are Cape Verdean (86.0%, a difference of 0.010%), Immigrants from Ireland (86.0%, a difference of 0.020%), Bermudan (86.0%, a difference of 0.030%), Maltese (86.0%, a difference of 0.030%), and Cambodian (86.0%, a difference of 0.040%).
| Demographics | Rating | Rank | In Labor Force | Age 25-29 |
| Immigrants | Ethiopia | 100.0 /100 | #11 | Exceptional 86.1% |
| Immigrants | Lithuania | 100.0 /100 | #12 | Exceptional 86.1% |
| Norwegians | 100.0 /100 | #13 | Exceptional 86.1% |
| Latvians | 100.0 /100 | #14 | Exceptional 86.1% |
| Bolivians | 100.0 /100 | #15 | Exceptional 86.1% |
| Immigrants | Bolivia | 100.0 /100 | #16 | Exceptional 86.1% |
| Bermudans | 100.0 /100 | #17 | Exceptional 86.0% |
| Bulgarians | 100.0 /100 | #18 | Exceptional 86.0% |
| Cape Verdeans | 100.0 /100 | #19 | Exceptional 86.0% |
| Immigrants | Ireland | 100.0 /100 | #20 | Exceptional 86.0% |
| Maltese | 100.0 /100 | #21 | Exceptional 86.0% |
| Cambodians | 100.0 /100 | #22 | Exceptional 86.0% |
| Immigrants | Uganda | 100.0 /100 | #23 | Exceptional 86.0% |
| Immigrants | Eastern Africa | 100.0 /100 | #24 | Exceptional 86.0% |
| Sudanese | 100.0 /100 | #25 | Exceptional 85.9% |