Immigrants from Eastern Europe vs Immigrants from Uzbekistan In Labor Force | Age 25-29
COMPARE
Immigrants from Eastern Europe
Immigrants from Uzbekistan
In Labor Force | Age 25-29
In Labor Force | Age 25-29 Comparison
Immigrants from Eastern Europe
Immigrants from Uzbekistan
85.2%
IN LABOR FORCE | AGE 25-29
96.8/ 100
METRIC RATING
84th/ 347
METRIC RANK
83.9%
IN LABOR FORCE | AGE 25-29
0.8/ 100
METRIC RATING
238th/ 347
METRIC RANK
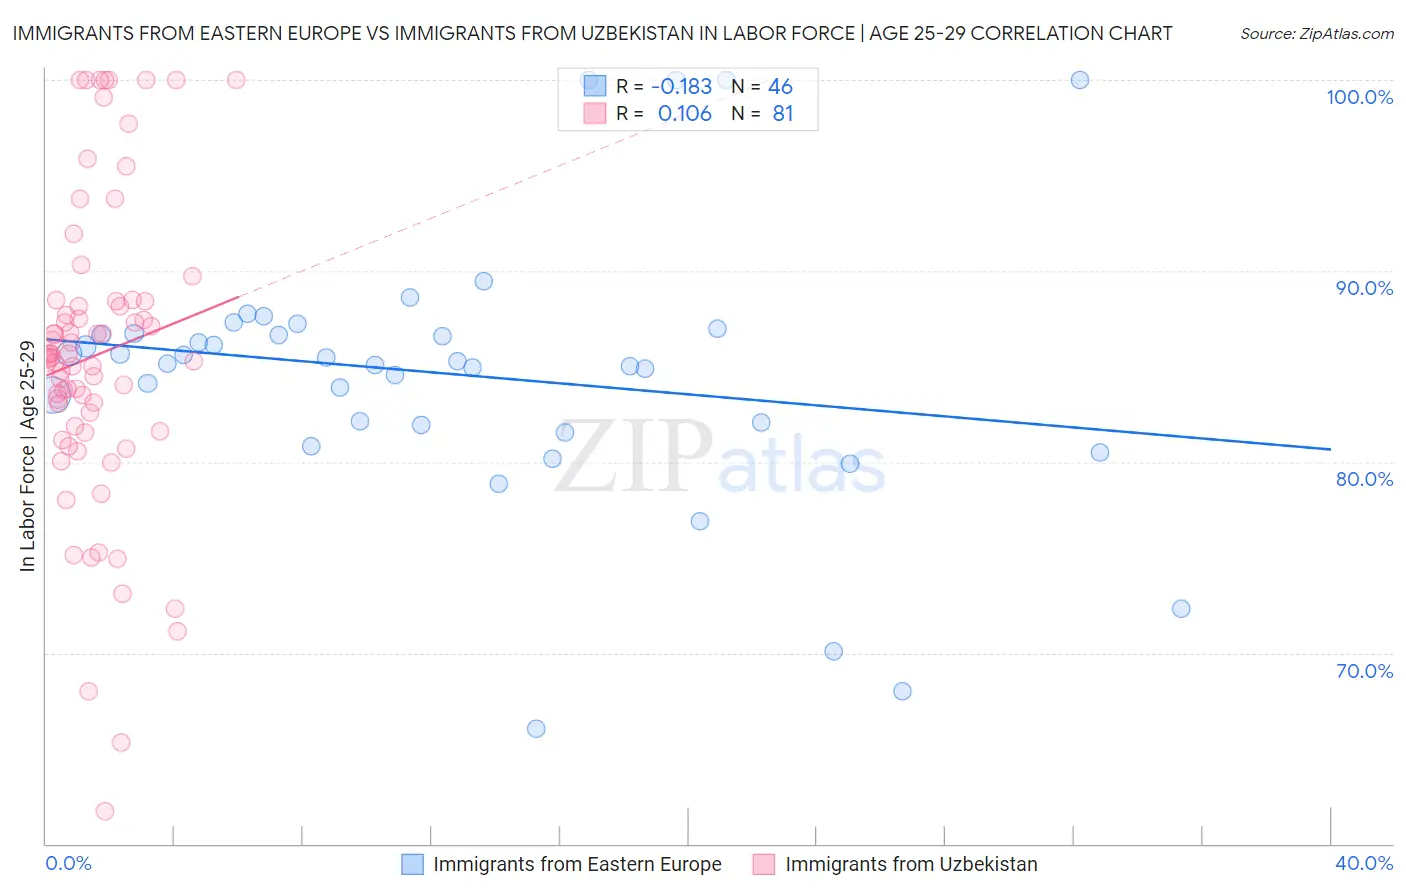
Immigrants from Eastern Europe vs Immigrants from Uzbekistan In Labor Force | Age 25-29 Correlation Chart
The statistical analysis conducted on geographies consisting of 475,521,938 people shows a poor negative correlation between the proportion of Immigrants from Eastern Europe and labor force participation rate among population between the ages 25 and 29 in the United States with a correlation coefficient (R) of -0.183 and weighted average of 85.2%. Similarly, the statistical analysis conducted on geographies consisting of 118,738,553 people shows a poor positive correlation between the proportion of Immigrants from Uzbekistan and labor force participation rate among population between the ages 25 and 29 in the United States with a correlation coefficient (R) of 0.106 and weighted average of 83.9%, a difference of 1.5%.
In Labor Force | Age 25-29 Correlation Summary
| Measurement | Immigrants from Eastern Europe | Immigrants from Uzbekistan |
| Minimum | 66.0% | 61.7% |
| Maximum | 100.0% | 100.0% |
| Range | 34.0% | 38.3% |
| Mean | 84.6% | 85.6% |
| Median | 85.2% | 85.5% |
| Interquartile 25% (IQ1) | 81.9% | 81.7% |
| Interquartile 75% (IQ3) | 86.7% | 88.4% |
| Interquartile Range (IQR) | 4.8% | 6.7% |
| Standard Deviation (Sample) | 7.0% | 8.0% |
| Standard Deviation (Population) | 7.0% | 8.0% |
Similar Demographics by In Labor Force | Age 25-29
Demographics Similar to Immigrants from Eastern Europe by In Labor Force | Age 25-29
In terms of in labor force | age 25-29, the demographic groups most similar to Immigrants from Eastern Europe are Immigrants from Europe (85.2%, a difference of 0.0%), Immigrants from Africa (85.2%, a difference of 0.0%), Okinawan (85.2%, a difference of 0.010%), Ukrainian (85.2%, a difference of 0.010%), and French Canadian (85.2%, a difference of 0.010%).
| Demographics | Rating | Rank | In Labor Force | Age 25-29 |
| Immigrants | South Central Asia | 97.9 /100 | #77 | Exceptional 85.2% |
| Immigrants | Egypt | 97.7 /100 | #78 | Exceptional 85.2% |
| Immigrants | Northern Africa | 97.6 /100 | #79 | Exceptional 85.2% |
| Immigrants | Zimbabwe | 97.6 /100 | #80 | Exceptional 85.2% |
| Immigrants | Northern Europe | 97.2 /100 | #81 | Exceptional 85.2% |
| Okinawans | 97.0 /100 | #82 | Exceptional 85.2% |
| Immigrants | Europe | 96.8 /100 | #83 | Exceptional 85.2% |
| Immigrants | Eastern Europe | 96.8 /100 | #84 | Exceptional 85.2% |
| Immigrants | Africa | 96.7 /100 | #85 | Exceptional 85.2% |
| Ukrainians | 96.7 /100 | #86 | Exceptional 85.2% |
| French Canadians | 96.5 /100 | #87 | Exceptional 85.2% |
| Immigrants | Croatia | 96.4 /100 | #88 | Exceptional 85.2% |
| Immigrants | France | 96.3 /100 | #89 | Exceptional 85.2% |
| Burmese | 95.9 /100 | #90 | Exceptional 85.1% |
| Immigrants | Moldova | 95.8 /100 | #91 | Exceptional 85.1% |
Demographics Similar to Immigrants from Uzbekistan by In Labor Force | Age 25-29
In terms of in labor force | age 25-29, the demographic groups most similar to Immigrants from Uzbekistan are Jamaican (83.9%, a difference of 0.0%), Trinidadian and Tobagonian (83.9%, a difference of 0.010%), Iraqi (83.9%, a difference of 0.030%), Guamanian/Chamorro (83.9%, a difference of 0.030%), and Immigrants (83.9%, a difference of 0.030%).
| Demographics | Rating | Rank | In Labor Force | Age 25-29 |
| Immigrants | Philippines | 4.7 /100 | #231 | Tragic 84.2% |
| Panamanians | 4.5 /100 | #232 | Tragic 84.2% |
| Immigrants | Western Asia | 2.7 /100 | #233 | Tragic 84.1% |
| Barbadians | 1.0 /100 | #234 | Tragic 83.9% |
| Iraqis | 0.9 /100 | #235 | Tragic 83.9% |
| Guamanians/Chamorros | 0.9 /100 | #236 | Tragic 83.9% |
| Immigrants | Immigrants | 0.9 /100 | #237 | Tragic 83.9% |
| Immigrants | Uzbekistan | 0.8 /100 | #238 | Tragic 83.9% |
| Jamaicans | 0.8 /100 | #239 | Tragic 83.9% |
| Trinidadians and Tobagonians | 0.7 /100 | #240 | Tragic 83.9% |
| Alsatians | 0.7 /100 | #241 | Tragic 83.9% |
| U.S. Virgin Islanders | 0.6 /100 | #242 | Tragic 83.8% |
| Salvadorans | 0.5 /100 | #243 | Tragic 83.8% |
| Immigrants | Jamaica | 0.4 /100 | #244 | Tragic 83.8% |
| Iroquois | 0.4 /100 | #245 | Tragic 83.8% |