Scandinavian vs Immigrants from Uzbekistan In Labor Force | Age 25-29
COMPARE
Scandinavian
Immigrants from Uzbekistan
In Labor Force | Age 25-29
In Labor Force | Age 25-29 Comparison
Scandinavians
Immigrants from Uzbekistan
84.9%
IN LABOR FORCE | AGE 25-29
85.1/ 100
METRIC RATING
122nd/ 347
METRIC RANK
83.9%
IN LABOR FORCE | AGE 25-29
0.8/ 100
METRIC RATING
238th/ 347
METRIC RANK
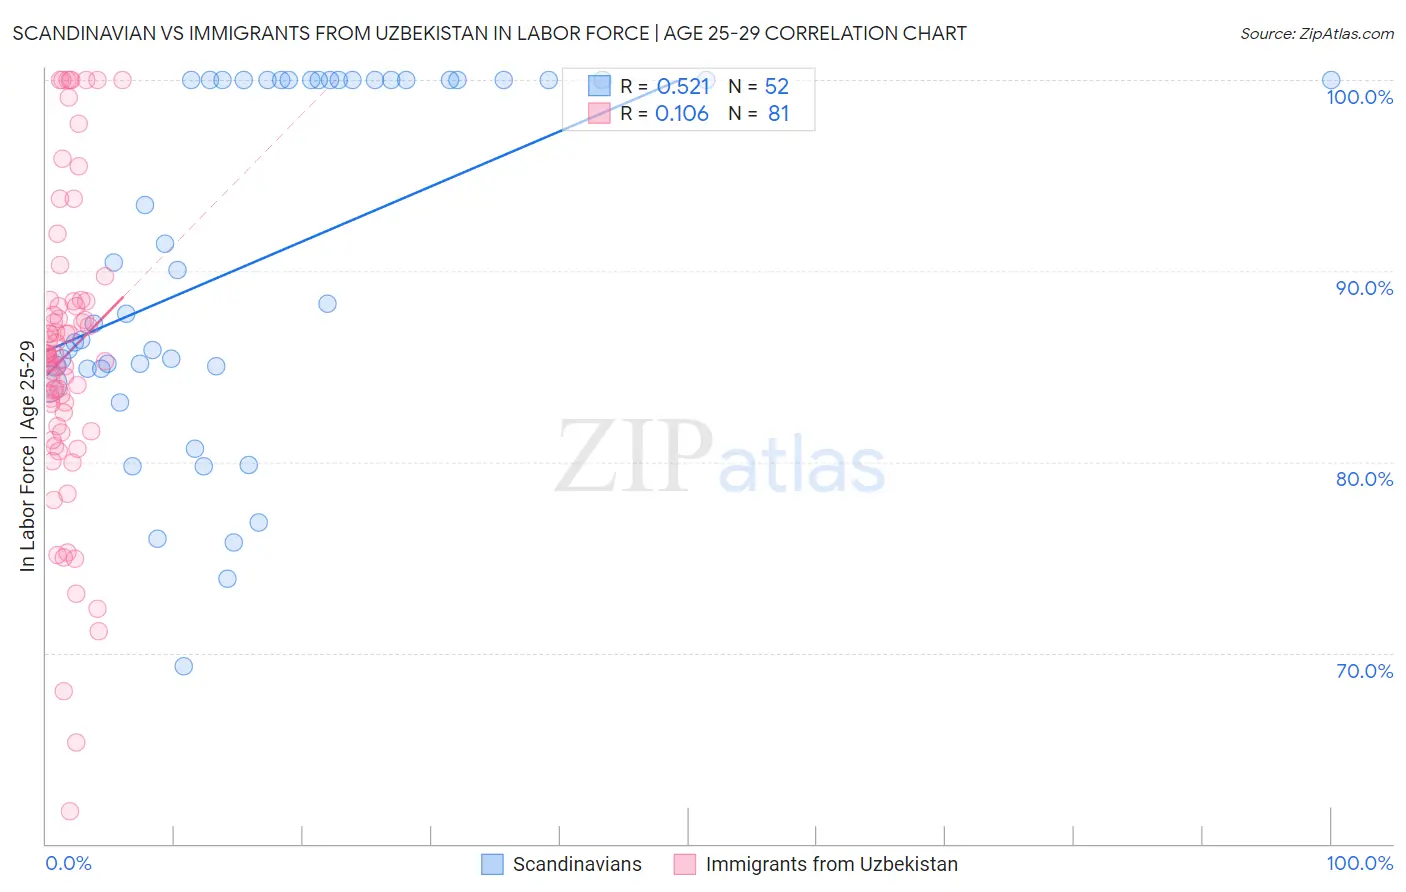
Scandinavian vs Immigrants from Uzbekistan In Labor Force | Age 25-29 Correlation Chart
The statistical analysis conducted on geographies consisting of 472,219,125 people shows a substantial positive correlation between the proportion of Scandinavians and labor force participation rate among population between the ages 25 and 29 in the United States with a correlation coefficient (R) of 0.521 and weighted average of 84.9%. Similarly, the statistical analysis conducted on geographies consisting of 118,738,553 people shows a poor positive correlation between the proportion of Immigrants from Uzbekistan and labor force participation rate among population between the ages 25 and 29 in the United States with a correlation coefficient (R) of 0.106 and weighted average of 83.9%, a difference of 1.2%.
In Labor Force | Age 25-29 Correlation Summary
| Measurement | Scandinavian | Immigrants from Uzbekistan |
| Minimum | 69.3% | 61.7% |
| Maximum | 100.0% | 100.0% |
| Range | 30.7% | 38.3% |
| Mean | 90.6% | 85.6% |
| Median | 89.2% | 85.5% |
| Interquartile 25% (IQ1) | 85.0% | 81.7% |
| Interquartile 75% (IQ3) | 100.0% | 88.4% |
| Interquartile Range (IQR) | 15.0% | 6.7% |
| Standard Deviation (Sample) | 9.1% | 8.0% |
| Standard Deviation (Population) | 9.0% | 8.0% |
Similar Demographics by In Labor Force | Age 25-29
Demographics Similar to Scandinavians by In Labor Force | Age 25-29
In terms of in labor force | age 25-29, the demographic groups most similar to Scandinavians are Dutch (84.9%, a difference of 0.0%), Immigrants from Iran (84.9%, a difference of 0.0%), Immigrants from South Africa (84.9%, a difference of 0.010%), Immigrants from Chile (84.9%, a difference of 0.010%), and Uruguayan (84.9%, a difference of 0.010%).
| Demographics | Rating | Rank | In Labor Force | Age 25-29 |
| South Africans | 88.9 /100 | #115 | Excellent 85.0% |
| Chileans | 88.8 /100 | #116 | Excellent 85.0% |
| Immigrants | Belarus | 88.0 /100 | #117 | Excellent 85.0% |
| Finns | 87.8 /100 | #118 | Excellent 85.0% |
| Filipinos | 87.1 /100 | #119 | Excellent 84.9% |
| Immigrants | South Africa | 86.1 /100 | #120 | Excellent 84.9% |
| Immigrants | Chile | 85.6 /100 | #121 | Excellent 84.9% |
| Scandinavians | 85.1 /100 | #122 | Excellent 84.9% |
| Dutch | 84.9 /100 | #123 | Excellent 84.9% |
| Immigrants | Iran | 84.8 /100 | #124 | Excellent 84.9% |
| Uruguayans | 84.7 /100 | #125 | Excellent 84.9% |
| Immigrants | Singapore | 84.4 /100 | #126 | Excellent 84.9% |
| Immigrants | Uruguay | 84.0 /100 | #127 | Excellent 84.9% |
| Australians | 83.6 /100 | #128 | Excellent 84.9% |
| Immigrants | Russia | 81.6 /100 | #129 | Excellent 84.9% |
Demographics Similar to Immigrants from Uzbekistan by In Labor Force | Age 25-29
In terms of in labor force | age 25-29, the demographic groups most similar to Immigrants from Uzbekistan are Jamaican (83.9%, a difference of 0.0%), Trinidadian and Tobagonian (83.9%, a difference of 0.010%), Iraqi (83.9%, a difference of 0.030%), Guamanian/Chamorro (83.9%, a difference of 0.030%), and Immigrants (83.9%, a difference of 0.030%).
| Demographics | Rating | Rank | In Labor Force | Age 25-29 |
| Immigrants | Philippines | 4.7 /100 | #231 | Tragic 84.2% |
| Panamanians | 4.5 /100 | #232 | Tragic 84.2% |
| Immigrants | Western Asia | 2.7 /100 | #233 | Tragic 84.1% |
| Barbadians | 1.0 /100 | #234 | Tragic 83.9% |
| Iraqis | 0.9 /100 | #235 | Tragic 83.9% |
| Guamanians/Chamorros | 0.9 /100 | #236 | Tragic 83.9% |
| Immigrants | Immigrants | 0.9 /100 | #237 | Tragic 83.9% |
| Immigrants | Uzbekistan | 0.8 /100 | #238 | Tragic 83.9% |
| Jamaicans | 0.8 /100 | #239 | Tragic 83.9% |
| Trinidadians and Tobagonians | 0.7 /100 | #240 | Tragic 83.9% |
| Alsatians | 0.7 /100 | #241 | Tragic 83.9% |
| U.S. Virgin Islanders | 0.6 /100 | #242 | Tragic 83.8% |
| Salvadorans | 0.5 /100 | #243 | Tragic 83.8% |
| Immigrants | Jamaica | 0.4 /100 | #244 | Tragic 83.8% |
| Iroquois | 0.4 /100 | #245 | Tragic 83.8% |