Korean vs Immigrants from Uzbekistan In Labor Force | Age 25-29
COMPARE
Korean
Immigrants from Uzbekistan
In Labor Force | Age 25-29
In Labor Force | Age 25-29 Comparison
Koreans
Immigrants from Uzbekistan
84.2%
IN LABOR FORCE | AGE 25-29
5.9/ 100
METRIC RATING
225th/ 347
METRIC RANK
83.9%
IN LABOR FORCE | AGE 25-29
0.8/ 100
METRIC RATING
238th/ 347
METRIC RANK
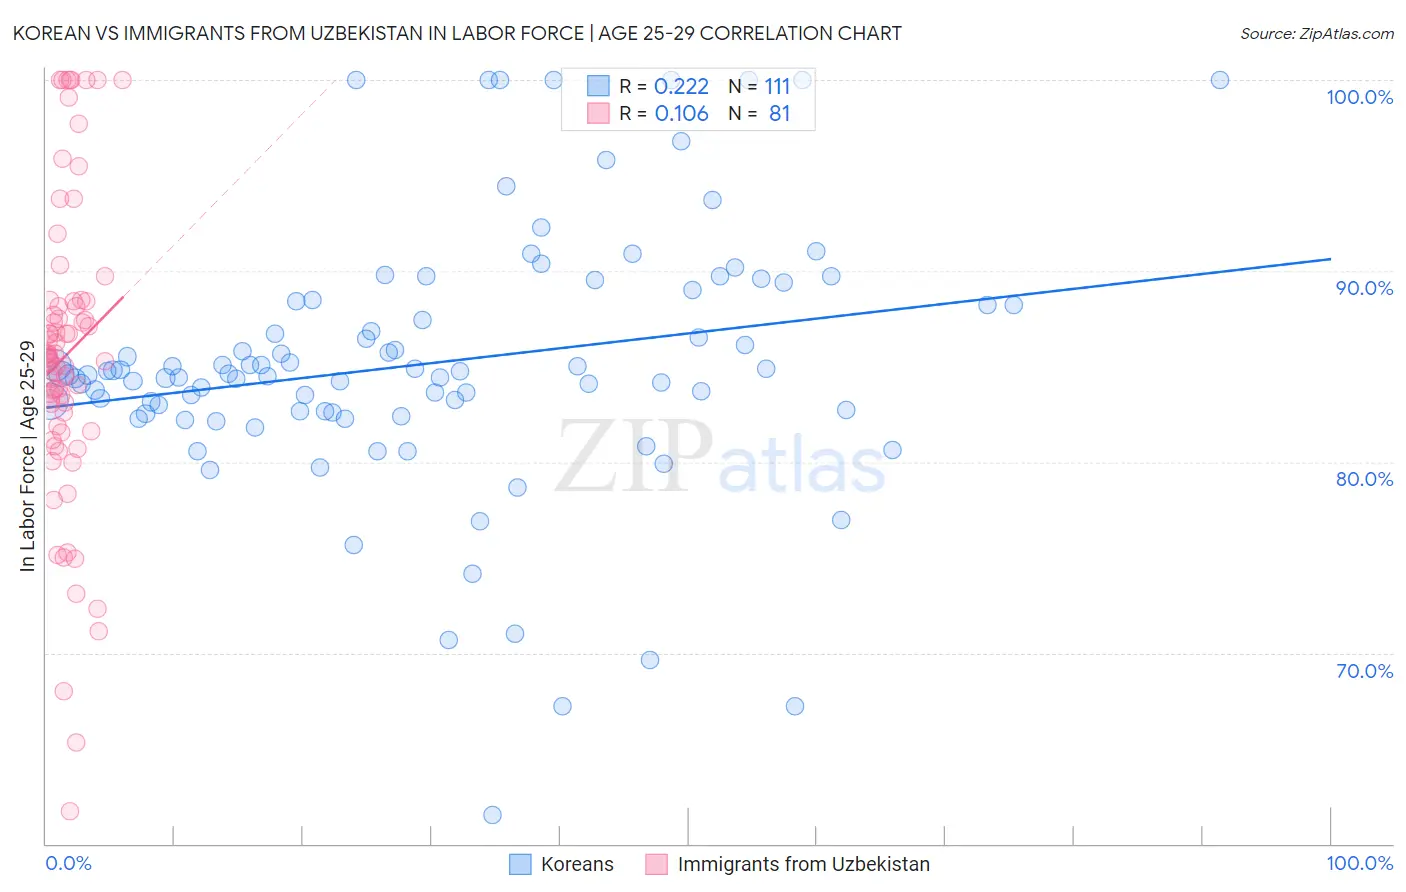
Korean vs Immigrants from Uzbekistan In Labor Force | Age 25-29 Correlation Chart
The statistical analysis conducted on geographies consisting of 510,593,269 people shows a weak positive correlation between the proportion of Koreans and labor force participation rate among population between the ages 25 and 29 in the United States with a correlation coefficient (R) of 0.222 and weighted average of 84.2%. Similarly, the statistical analysis conducted on geographies consisting of 118,738,553 people shows a poor positive correlation between the proportion of Immigrants from Uzbekistan and labor force participation rate among population between the ages 25 and 29 in the United States with a correlation coefficient (R) of 0.106 and weighted average of 83.9%, a difference of 0.38%.
In Labor Force | Age 25-29 Correlation Summary
| Measurement | Korean | Immigrants from Uzbekistan |
| Minimum | 61.5% | 61.7% |
| Maximum | 100.0% | 100.0% |
| Range | 38.5% | 38.3% |
| Mean | 85.2% | 85.6% |
| Median | 84.6% | 85.5% |
| Interquartile 25% (IQ1) | 82.6% | 81.7% |
| Interquartile 75% (IQ3) | 88.4% | 88.4% |
| Interquartile Range (IQR) | 5.8% | 6.7% |
| Standard Deviation (Sample) | 6.8% | 8.0% |
| Standard Deviation (Population) | 6.8% | 8.0% |
Demographics Similar to Koreans and Immigrants from Uzbekistan by In Labor Force | Age 25-29
In terms of in labor force | age 25-29, the demographic groups most similar to Koreans are Immigrants from Congo (84.2%, a difference of 0.0%), Immigrants from West Indies (84.2%, a difference of 0.010%), French American Indian (84.2%, a difference of 0.010%), Immigrants from Panama (84.2%, a difference of 0.010%), and Scotch-Irish (84.2%, a difference of 0.020%). Similarly, the demographic groups most similar to Immigrants from Uzbekistan are Jamaican (83.9%, a difference of 0.0%), Trinidadian and Tobagonian (83.9%, a difference of 0.010%), Iraqi (83.9%, a difference of 0.030%), Guamanian/Chamorro (83.9%, a difference of 0.030%), and Immigrants (83.9%, a difference of 0.030%).
| Demographics | Rating | Rank | In Labor Force | Age 25-29 |
| Arabs | 6.8 /100 | #221 | Tragic 84.2% |
| Jordanians | 6.7 /100 | #222 | Tragic 84.2% |
| Scotch-Irish | 6.5 /100 | #223 | Tragic 84.2% |
| Immigrants | West Indies | 6.0 /100 | #224 | Tragic 84.2% |
| Koreans | 5.9 /100 | #225 | Tragic 84.2% |
| Immigrants | Congo | 5.8 /100 | #226 | Tragic 84.2% |
| French American Indians | 5.5 /100 | #227 | Tragic 84.2% |
| Immigrants | Panama | 5.5 /100 | #228 | Tragic 84.2% |
| Immigrants | Oceania | 5.0 /100 | #229 | Tragic 84.2% |
| Whites/Caucasians | 4.8 /100 | #230 | Tragic 84.2% |
| Immigrants | Philippines | 4.7 /100 | #231 | Tragic 84.2% |
| Panamanians | 4.5 /100 | #232 | Tragic 84.2% |
| Immigrants | Western Asia | 2.7 /100 | #233 | Tragic 84.1% |
| Barbadians | 1.0 /100 | #234 | Tragic 83.9% |
| Iraqis | 0.9 /100 | #235 | Tragic 83.9% |
| Guamanians/Chamorros | 0.9 /100 | #236 | Tragic 83.9% |
| Immigrants | Immigrants | 0.9 /100 | #237 | Tragic 83.9% |
| Immigrants | Uzbekistan | 0.8 /100 | #238 | Tragic 83.9% |
| Jamaicans | 0.8 /100 | #239 | Tragic 83.9% |
| Trinidadians and Tobagonians | 0.7 /100 | #240 | Tragic 83.9% |
| Alsatians | 0.7 /100 | #241 | Tragic 83.9% |