Immigrants from Dominican Republic vs Belizean In Labor Force | Age 30-34
COMPARE
Immigrants from Dominican Republic
Belizean
In Labor Force | Age 30-34
In Labor Force | Age 30-34 Comparison
Immigrants from Dominican Republic
Belizeans
83.8%
IN LABOR FORCE | AGE 30-34
0.3/ 100
METRIC RATING
260th/ 347
METRIC RANK
83.5%
IN LABOR FORCE | AGE 30-34
0.0/ 100
METRIC RATING
274th/ 347
METRIC RANK
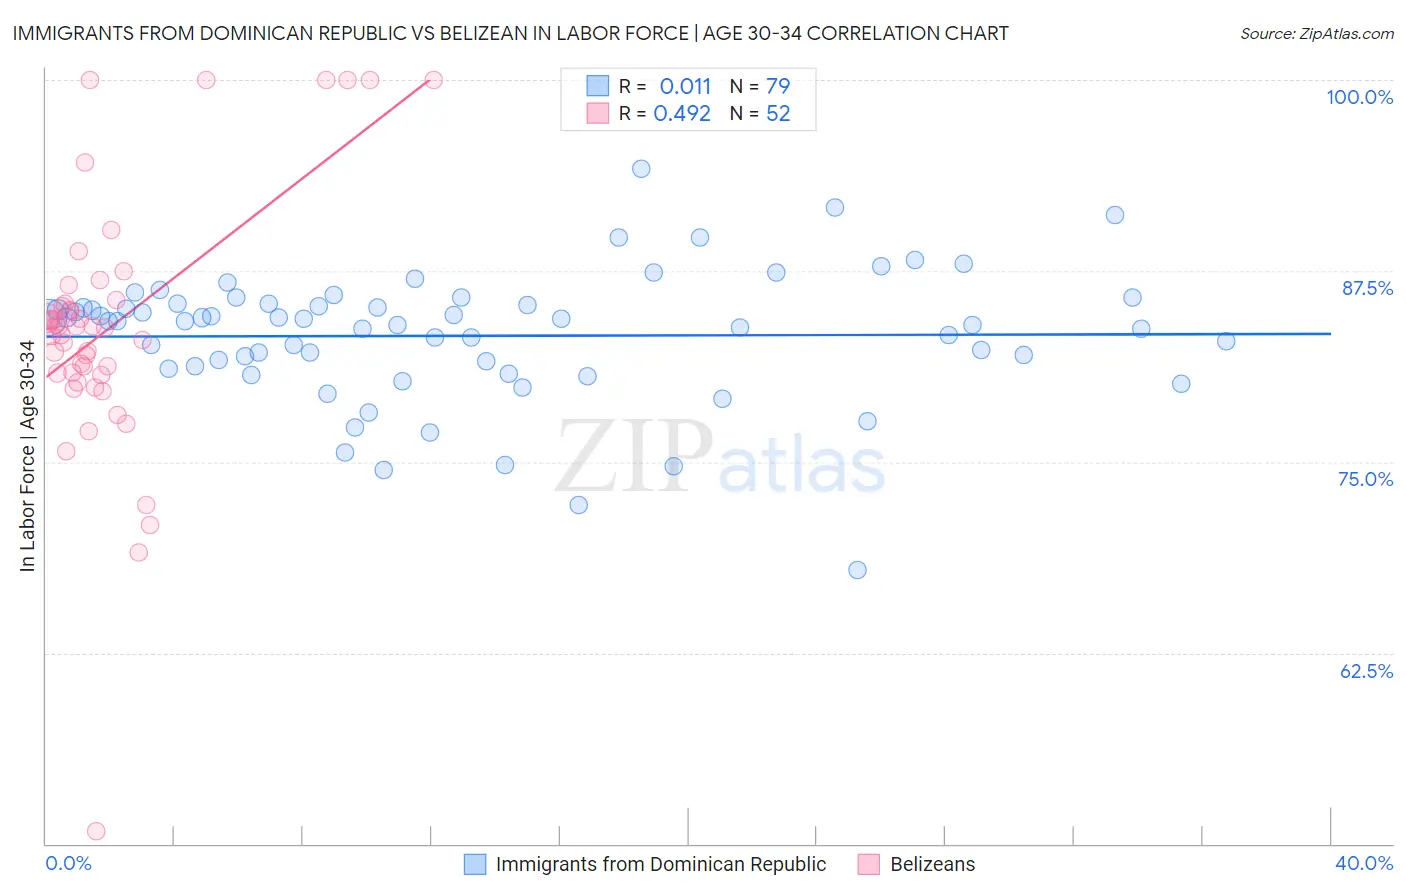
Immigrants from Dominican Republic vs Belizean In Labor Force | Age 30-34 Correlation Chart
The statistical analysis conducted on geographies consisting of 274,867,457 people shows no correlation between the proportion of Immigrants from Dominican Republic and labor force participation rate among population between the ages 30 and 34 in the United States with a correlation coefficient (R) of 0.011 and weighted average of 83.8%. Similarly, the statistical analysis conducted on geographies consisting of 144,194,456 people shows a moderate positive correlation between the proportion of Belizeans and labor force participation rate among population between the ages 30 and 34 in the United States with a correlation coefficient (R) of 0.492 and weighted average of 83.5%, a difference of 0.38%.
In Labor Force | Age 30-34 Correlation Summary
| Measurement | Immigrants from Dominican Republic | Belizean |
| Minimum | 67.9% | 50.8% |
| Maximum | 94.2% | 100.0% |
| Range | 26.3% | 49.2% |
| Mean | 83.3% | 83.8% |
| Median | 84.2% | 83.8% |
| Interquartile 25% (IQ1) | 81.2% | 80.8% |
| Interquartile 75% (IQ3) | 85.3% | 85.5% |
| Interquartile Range (IQR) | 4.1% | 4.7% |
| Standard Deviation (Sample) | 4.3% | 8.5% |
| Standard Deviation (Population) | 4.3% | 8.4% |
Demographics Similar to Immigrants from Dominican Republic and Belizeans by In Labor Force | Age 30-34
In terms of in labor force | age 30-34, the demographic groups most similar to Immigrants from Dominican Republic are Guyanese (83.8%, a difference of 0.010%), Honduran (83.8%, a difference of 0.020%), Scotch-Irish (83.8%, a difference of 0.020%), Dominican (83.8%, a difference of 0.020%), and Immigrants from Guyana (83.8%, a difference of 0.030%). Similarly, the demographic groups most similar to Belizeans are Guamanian/Chamorro (83.5%, a difference of 0.010%), Immigrants from Grenada (83.5%, a difference of 0.010%), Tongan (83.5%, a difference of 0.020%), Delaware (83.5%, a difference of 0.030%), and Spanish (83.5%, a difference of 0.060%).
| Demographics | Rating | Rank | In Labor Force | Age 30-34 |
| Iraqis | 0.3 /100 | #257 | Tragic 83.8% |
| Hondurans | 0.3 /100 | #258 | Tragic 83.8% |
| Scotch-Irish | 0.3 /100 | #259 | Tragic 83.8% |
| Immigrants | Dominican Republic | 0.3 /100 | #260 | Tragic 83.8% |
| Guyanese | 0.3 /100 | #261 | Tragic 83.8% |
| Dominicans | 0.2 /100 | #262 | Tragic 83.8% |
| Immigrants | Guyana | 0.2 /100 | #263 | Tragic 83.8% |
| Guatemalans | 0.2 /100 | #264 | Tragic 83.7% |
| Immigrants | Honduras | 0.1 /100 | #265 | Tragic 83.7% |
| Immigrants | Guatemala | 0.1 /100 | #266 | Tragic 83.7% |
| Spaniards | 0.1 /100 | #267 | Tragic 83.6% |
| Immigrants | Bangladesh | 0.1 /100 | #268 | Tragic 83.6% |
| Vietnamese | 0.1 /100 | #269 | Tragic 83.6% |
| Spanish Americans | 0.0 /100 | #270 | Tragic 83.5% |
| Spanish | 0.0 /100 | #271 | Tragic 83.5% |
| Immigrants | Nonimmigrants | 0.0 /100 | #272 | Tragic 83.5% |
| Guamanians/Chamorros | 0.0 /100 | #273 | Tragic 83.5% |
| Belizeans | 0.0 /100 | #274 | Tragic 83.5% |
| Immigrants | Grenada | 0.0 /100 | #275 | Tragic 83.5% |
| Tongans | 0.0 /100 | #276 | Tragic 83.5% |
| Delaware | 0.0 /100 | #277 | Tragic 83.5% |