Immigrants from Cuba vs Polish In Labor Force | Age 20-64
COMPARE
Immigrants from Cuba
Polish
In Labor Force | Age 20-64
In Labor Force | Age 20-64 Comparison
Immigrants from Cuba
Poles
79.7%
IN LABOR FORCE | AGE 20-64
66.7/ 100
METRIC RATING
159th/ 347
METRIC RANK
80.1%
IN LABOR FORCE | AGE 20-64
96.8/ 100
METRIC RATING
90th/ 347
METRIC RANK
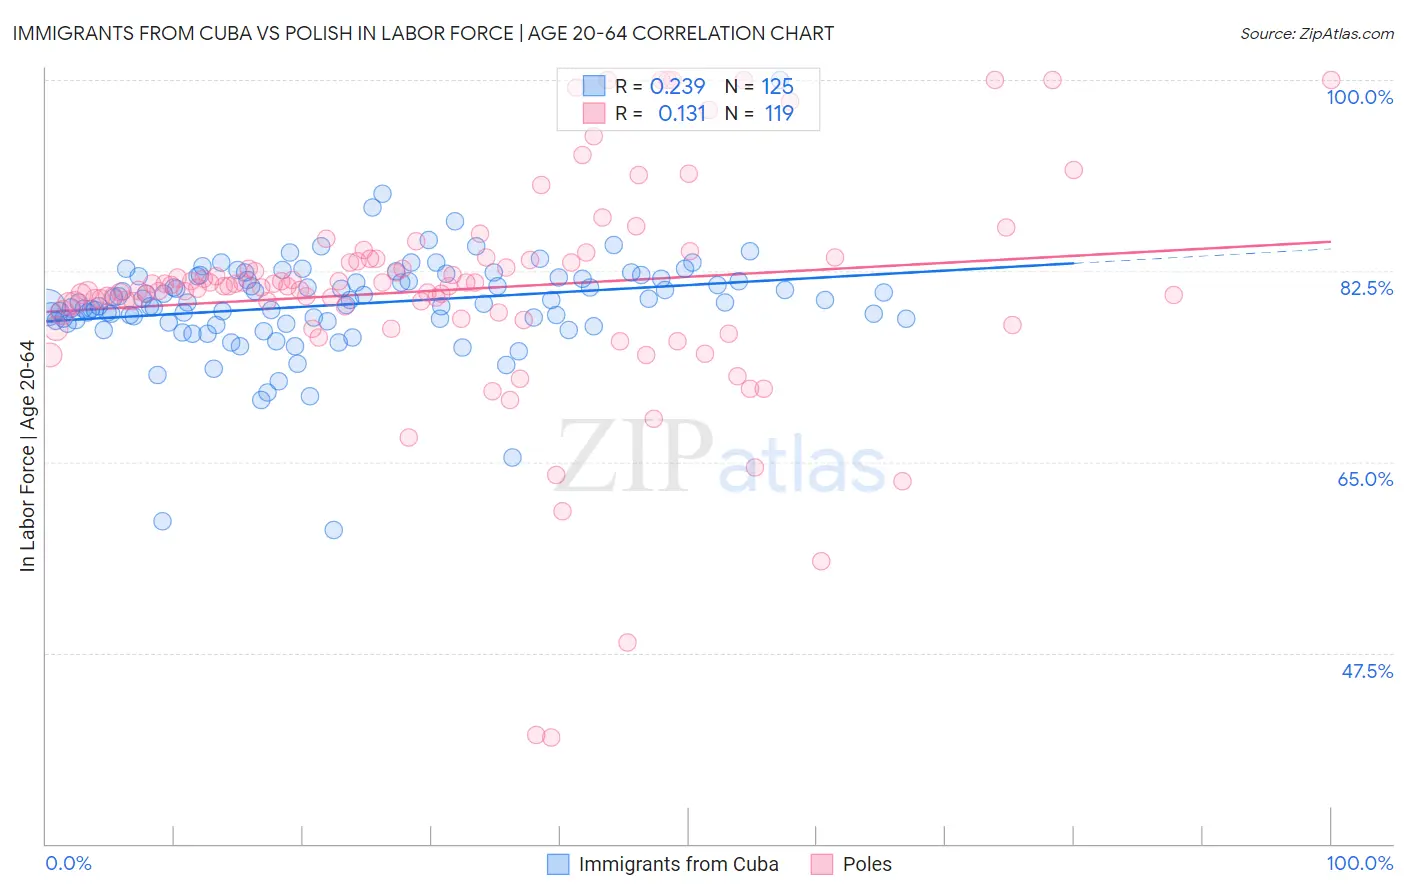
Immigrants from Cuba vs Polish In Labor Force | Age 20-64 Correlation Chart
The statistical analysis conducted on geographies consisting of 326,009,980 people shows a weak positive correlation between the proportion of Immigrants from Cuba and labor force participation rate among population between the ages 20 and 64 in the United States with a correlation coefficient (R) of 0.239 and weighted average of 79.7%. Similarly, the statistical analysis conducted on geographies consisting of 560,599,725 people shows a poor positive correlation between the proportion of Poles and labor force participation rate among population between the ages 20 and 64 in the United States with a correlation coefficient (R) of 0.131 and weighted average of 80.1%, a difference of 0.54%.
In Labor Force | Age 20-64 Correlation Summary
| Measurement | Immigrants from Cuba | Polish |
| Minimum | 58.8% | 39.8% |
| Maximum | 100.0% | 100.0% |
| Range | 41.2% | 60.2% |
| Mean | 79.4% | 80.8% |
| Median | 79.6% | 81.1% |
| Interquartile 25% (IQ1) | 77.9% | 78.7% |
| Interquartile 75% (IQ3) | 81.9% | 83.6% |
| Interquartile Range (IQR) | 3.9% | 4.9% |
| Standard Deviation (Sample) | 4.7% | 10.2% |
| Standard Deviation (Population) | 4.7% | 10.2% |
Similar Demographics by In Labor Force | Age 20-64
Demographics Similar to Immigrants from Cuba by In Labor Force | Age 20-64
In terms of in labor force | age 20-64, the demographic groups most similar to Immigrants from Cuba are Moroccan (79.7%, a difference of 0.0%), South African (79.7%, a difference of 0.0%), Austrian (79.7%, a difference of 0.010%), German (79.7%, a difference of 0.010%), and New Zealander (79.7%, a difference of 0.020%).
| Demographics | Rating | Rank | In Labor Force | Age 20-64 |
| Immigrants | Northern Europe | 72.0 /100 | #152 | Good 79.7% |
| Immigrants | Kazakhstan | 69.5 /100 | #153 | Good 79.7% |
| New Zealanders | 69.4 /100 | #154 | Good 79.7% |
| Immigrants | South Africa | 69.2 /100 | #155 | Good 79.7% |
| Senegalese | 69.1 /100 | #156 | Good 79.7% |
| Immigrants | China | 69.1 /100 | #157 | Good 79.7% |
| Austrians | 67.6 /100 | #158 | Good 79.7% |
| Immigrants | Cuba | 66.7 /100 | #159 | Good 79.7% |
| Moroccans | 66.7 /100 | #160 | Good 79.7% |
| South Africans | 66.2 /100 | #161 | Good 79.7% |
| Germans | 65.2 /100 | #162 | Good 79.7% |
| Immigrants | Costa Rica | 64.6 /100 | #163 | Good 79.7% |
| Immigrants | Burma/Myanmar | 64.4 /100 | #164 | Good 79.7% |
| Nigerians | 64.0 /100 | #165 | Good 79.7% |
| Okinawans | 62.7 /100 | #166 | Good 79.6% |
Demographics Similar to Poles by In Labor Force | Age 20-64
In terms of in labor force | age 20-64, the demographic groups most similar to Poles are Immigrants from Venezuela (80.1%, a difference of 0.0%), Uruguayan (80.1%, a difference of 0.0%), Chilean (80.1%, a difference of 0.010%), Ghanaian (80.1%, a difference of 0.010%), and Immigrants from Egypt (80.1%, a difference of 0.020%).
| Demographics | Rating | Rank | In Labor Force | Age 20-64 |
| Colombians | 97.3 /100 | #83 | Exceptional 80.1% |
| Immigrants | Latvia | 97.2 /100 | #84 | Exceptional 80.1% |
| Jordanians | 97.2 /100 | #85 | Exceptional 80.1% |
| Immigrants | Egypt | 97.1 /100 | #86 | Exceptional 80.1% |
| Croatians | 97.1 /100 | #87 | Exceptional 80.1% |
| Chileans | 97.0 /100 | #88 | Exceptional 80.1% |
| Immigrants | Venezuela | 96.8 /100 | #89 | Exceptional 80.1% |
| Poles | 96.8 /100 | #90 | Exceptional 80.1% |
| Uruguayans | 96.7 /100 | #91 | Exceptional 80.1% |
| Ghanaians | 96.7 /100 | #92 | Exceptional 80.1% |
| Immigrants | Belarus | 96.4 /100 | #93 | Exceptional 80.1% |
| Immigrants | Asia | 96.0 /100 | #94 | Exceptional 80.1% |
| Yugoslavians | 95.9 /100 | #95 | Exceptional 80.1% |
| Immigrants | Malaysia | 95.9 /100 | #96 | Exceptional 80.1% |
| South Americans | 95.9 /100 | #97 | Exceptional 80.1% |