Immigrants from Ireland vs Immigrants from Central America In Labor Force | Age 30-34
COMPARE
Immigrants from Ireland
Immigrants from Central America
In Labor Force | Age 30-34
In Labor Force | Age 30-34 Comparison
Immigrants from Ireland
Immigrants from Central America
86.3%
IN LABOR FORCE | AGE 30-34
100.0/ 100
METRIC RATING
5th/ 347
METRIC RANK
82.5%
IN LABOR FORCE | AGE 30-34
0.0/ 100
METRIC RATING
299th/ 347
METRIC RANK
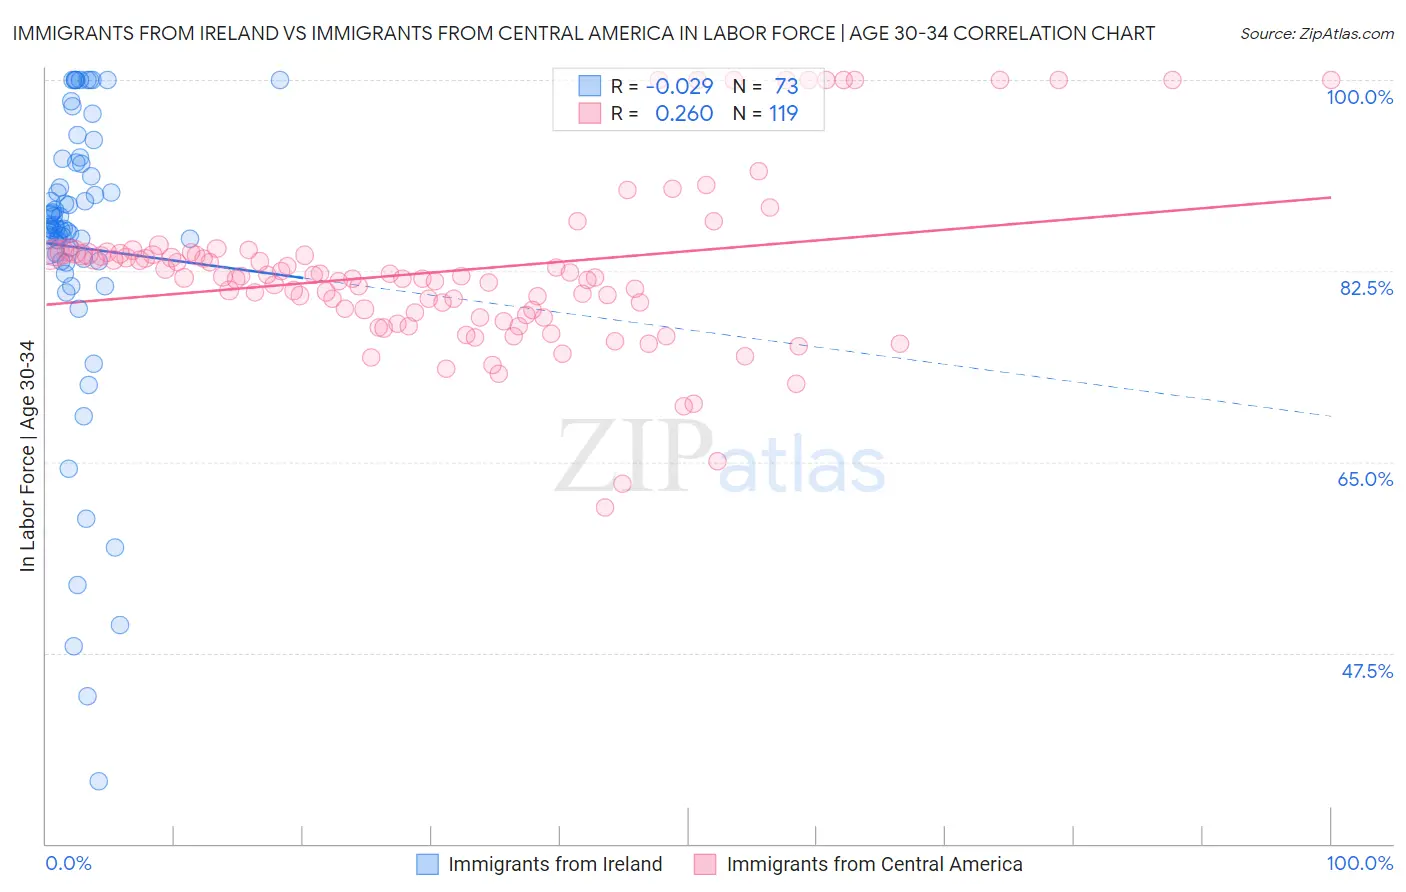
Immigrants from Ireland vs Immigrants from Central America In Labor Force | Age 30-34 Correlation Chart
The statistical analysis conducted on geographies consisting of 240,718,407 people shows no correlation between the proportion of Immigrants from Ireland and labor force participation rate among population between the ages 30 and 34 in the United States with a correlation coefficient (R) of -0.029 and weighted average of 86.3%. Similarly, the statistical analysis conducted on geographies consisting of 535,746,128 people shows a weak positive correlation between the proportion of Immigrants from Central America and labor force participation rate among population between the ages 30 and 34 in the United States with a correlation coefficient (R) of 0.260 and weighted average of 82.5%, a difference of 4.6%.
In Labor Force | Age 30-34 Correlation Summary
| Measurement | Immigrants from Ireland | Immigrants from Central America |
| Minimum | 35.7% | 60.8% |
| Maximum | 100.0% | 100.0% |
| Range | 64.3% | 39.2% |
| Mean | 84.6% | 82.5% |
| Median | 86.5% | 81.9% |
| Interquartile 25% (IQ1) | 83.4% | 78.4% |
| Interquartile 75% (IQ3) | 92.4% | 84.1% |
| Interquartile Range (IQR) | 8.9% | 5.7% |
| Standard Deviation (Sample) | 13.7% | 7.6% |
| Standard Deviation (Population) | 13.6% | 7.5% |
Similar Demographics by In Labor Force | Age 30-34
Demographics Similar to Immigrants from Ireland by In Labor Force | Age 30-34
In terms of in labor force | age 30-34, the demographic groups most similar to Immigrants from Ireland are Somali (86.2%, a difference of 0.030%), Immigrants from Bolivia (86.2%, a difference of 0.040%), Cambodian (86.2%, a difference of 0.060%), Immigrants from Somalia (86.2%, a difference of 0.070%), and Immigrants from Serbia (86.2%, a difference of 0.10%).
| Demographics | Rating | Rank | In Labor Force | Age 30-34 |
| Luxembourgers | 100.0 /100 | #1 | Exceptional 86.6% |
| Ethiopians | 100.0 /100 | #2 | Exceptional 86.6% |
| Immigrants | Ethiopia | 100.0 /100 | #3 | Exceptional 86.6% |
| Liberians | 100.0 /100 | #4 | Exceptional 86.4% |
| Immigrants | Ireland | 100.0 /100 | #5 | Exceptional 86.3% |
| Somalis | 100.0 /100 | #6 | Exceptional 86.2% |
| Immigrants | Bolivia | 100.0 /100 | #7 | Exceptional 86.2% |
| Cambodians | 100.0 /100 | #8 | Exceptional 86.2% |
| Immigrants | Somalia | 100.0 /100 | #9 | Exceptional 86.2% |
| Immigrants | Serbia | 100.0 /100 | #10 | Exceptional 86.2% |
| Carpatho Rusyns | 100.0 /100 | #11 | Exceptional 86.2% |
| Bolivians | 100.0 /100 | #12 | Exceptional 86.1% |
| Immigrants | Croatia | 100.0 /100 | #13 | Exceptional 86.1% |
| Immigrants | Cabo Verde | 100.0 /100 | #14 | Exceptional 86.1% |
| Immigrants | Albania | 100.0 /100 | #15 | Exceptional 86.1% |
Demographics Similar to Immigrants from Central America by In Labor Force | Age 30-34
In terms of in labor force | age 30-34, the demographic groups most similar to Immigrants from Central America are Hmong (82.4%, a difference of 0.060%), Hispanic or Latino (82.4%, a difference of 0.070%), Ottawa (82.4%, a difference of 0.10%), Immigrants from Micronesia (82.4%, a difference of 0.11%), and Comanche (82.6%, a difference of 0.13%).
| Demographics | Rating | Rank | In Labor Force | Age 30-34 |
| Blacks/African Americans | 0.0 /100 | #292 | Tragic 82.8% |
| Nepalese | 0.0 /100 | #293 | Tragic 82.7% |
| Americans | 0.0 /100 | #294 | Tragic 82.7% |
| Pennsylvania Germans | 0.0 /100 | #295 | Tragic 82.6% |
| Chippewa | 0.0 /100 | #296 | Tragic 82.6% |
| Comanche | 0.0 /100 | #297 | Tragic 82.6% |
| Aleuts | 0.0 /100 | #298 | Tragic 82.6% |
| Immigrants | Central America | 0.0 /100 | #299 | Tragic 82.5% |
| Hmong | 0.0 /100 | #300 | Tragic 82.4% |
| Hispanics or Latinos | 0.0 /100 | #301 | Tragic 82.4% |
| Ottawa | 0.0 /100 | #302 | Tragic 82.4% |
| Immigrants | Micronesia | 0.0 /100 | #303 | Tragic 82.4% |
| Tlingit-Haida | 0.0 /100 | #304 | Tragic 82.3% |
| Osage | 0.0 /100 | #305 | Tragic 82.3% |
| Spanish American Indians | 0.0 /100 | #306 | Tragic 82.2% |