Immigrants from Eastern Asia vs Jordanian In Labor Force | Age 16-19
COMPARE
Immigrants from Eastern Asia
Jordanian
In Labor Force | Age 16-19
In Labor Force | Age 16-19 Comparison
Immigrants from Eastern Asia
Jordanians
32.0%
IN LABOR FORCE | AGE 16-19
0.0/ 100
METRIC RATING
309th/ 347
METRIC RANK
36.4%
IN LABOR FORCE | AGE 16-19
39.6/ 100
METRIC RATING
181st/ 347
METRIC RANK
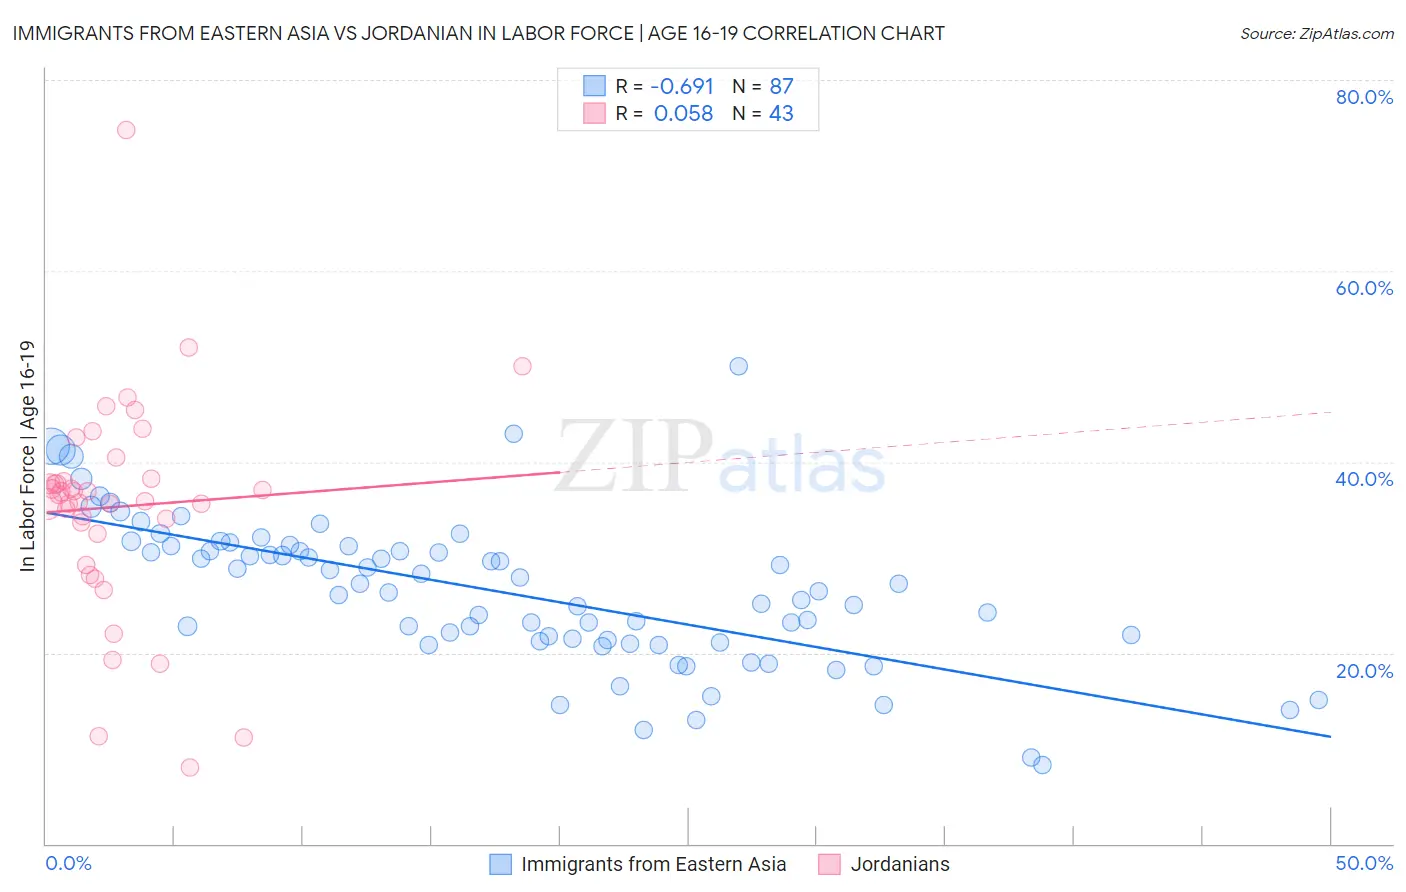
Immigrants from Eastern Asia vs Jordanian In Labor Force | Age 16-19 Correlation Chart
The statistical analysis conducted on geographies consisting of 498,676,879 people shows a significant negative correlation between the proportion of Immigrants from Eastern Asia and labor force participation rate among population between the ages 16 and 19 in the United States with a correlation coefficient (R) of -0.691 and weighted average of 32.0%. Similarly, the statistical analysis conducted on geographies consisting of 166,360,707 people shows a slight positive correlation between the proportion of Jordanians and labor force participation rate among population between the ages 16 and 19 in the United States with a correlation coefficient (R) of 0.058 and weighted average of 36.4%, a difference of 13.6%.
In Labor Force | Age 16-19 Correlation Summary
| Measurement | Immigrants from Eastern Asia | Jordanian |
| Minimum | 8.3% | 8.0% |
| Maximum | 50.0% | 74.8% |
| Range | 41.7% | 66.8% |
| Mean | 26.4% | 35.3% |
| Median | 26.4% | 36.5% |
| Interquartile 25% (IQ1) | 21.2% | 32.5% |
| Interquartile 75% (IQ3) | 31.2% | 38.2% |
| Interquartile Range (IQR) | 10.0% | 5.7% |
| Standard Deviation (Sample) | 7.7% | 11.5% |
| Standard Deviation (Population) | 7.7% | 11.3% |
Similar Demographics by In Labor Force | Age 16-19
Demographics Similar to Immigrants from Eastern Asia by In Labor Force | Age 16-19
In terms of in labor force | age 16-19, the demographic groups most similar to Immigrants from Eastern Asia are Immigrants from Iran (32.0%, a difference of 0.14%), Navajo (32.1%, a difference of 0.18%), Indian (Asian) (31.9%, a difference of 0.50%), Immigrants from Jamaica (32.2%, a difference of 0.53%), and Immigrants from Belize (31.8%, a difference of 0.65%).
| Demographics | Rating | Rank | In Labor Force | Age 16-19 |
| Belizeans | 0.0 /100 | #302 | Tragic 32.8% |
| Immigrants | Dominica | 0.0 /100 | #303 | Tragic 32.5% |
| Israelis | 0.0 /100 | #304 | Tragic 32.4% |
| Nicaraguans | 0.0 /100 | #305 | Tragic 32.4% |
| Spanish American Indians | 0.0 /100 | #306 | Tragic 32.4% |
| Immigrants | Jamaica | 0.0 /100 | #307 | Tragic 32.2% |
| Navajo | 0.0 /100 | #308 | Tragic 32.1% |
| Immigrants | Eastern Asia | 0.0 /100 | #309 | Tragic 32.0% |
| Immigrants | Iran | 0.0 /100 | #310 | Tragic 32.0% |
| Indians (Asian) | 0.0 /100 | #311 | Tragic 31.9% |
| Immigrants | Belize | 0.0 /100 | #312 | Tragic 31.8% |
| Hopi | 0.0 /100 | #313 | Tragic 31.8% |
| Cubans | 0.0 /100 | #314 | Tragic 31.8% |
| Immigrants | West Indies | 0.0 /100 | #315 | Tragic 31.7% |
| Filipinos | 0.0 /100 | #316 | Tragic 31.7% |
Demographics Similar to Jordanians by In Labor Force | Age 16-19
In terms of in labor force | age 16-19, the demographic groups most similar to Jordanians are Immigrants from Italy (36.4%, a difference of 0.030%), Eastern European (36.4%, a difference of 0.040%), Immigrants from Morocco (36.4%, a difference of 0.080%), Costa Rican (36.3%, a difference of 0.19%), and Immigrants from Southern Europe (36.4%, a difference of 0.20%).
| Demographics | Rating | Rank | In Labor Force | Age 16-19 |
| Immigrants | Czechoslovakia | 50.0 /100 | #174 | Average 36.6% |
| Natives/Alaskans | 49.0 /100 | #175 | Average 36.6% |
| Albanians | 48.8 /100 | #176 | Average 36.5% |
| Immigrants | Northern Europe | 46.6 /100 | #177 | Average 36.5% |
| Blacks/African Americans | 45.1 /100 | #178 | Average 36.5% |
| Immigrants | Southern Europe | 43.3 /100 | #179 | Average 36.4% |
| Immigrants | Morocco | 41.1 /100 | #180 | Average 36.4% |
| Jordanians | 39.6 /100 | #181 | Fair 36.4% |
| Immigrants | Italy | 39.1 /100 | #182 | Fair 36.4% |
| Eastern Europeans | 38.8 /100 | #183 | Fair 36.4% |
| Costa Ricans | 36.1 /100 | #184 | Fair 36.3% |
| Bhutanese | 35.3 /100 | #185 | Fair 36.3% |
| Immigrants | Romania | 34.0 /100 | #186 | Fair 36.3% |
| Immigrants | Afghanistan | 34.0 /100 | #187 | Fair 36.3% |
| Immigrants | Europe | 31.8 /100 | #188 | Fair 36.2% |