Immigrants from Guatemala vs Korean In Labor Force | Age 20-64
COMPARE
Immigrants from Guatemala
Korean
In Labor Force | Age 20-64
In Labor Force | Age 20-64 Comparison
Immigrants from Guatemala
Koreans
78.7%
IN LABOR FORCE | AGE 20-64
0.4/ 100
METRIC RATING
258th/ 347
METRIC RANK
79.8%
IN LABOR FORCE | AGE 20-64
79.6/ 100
METRIC RATING
144th/ 347
METRIC RANK
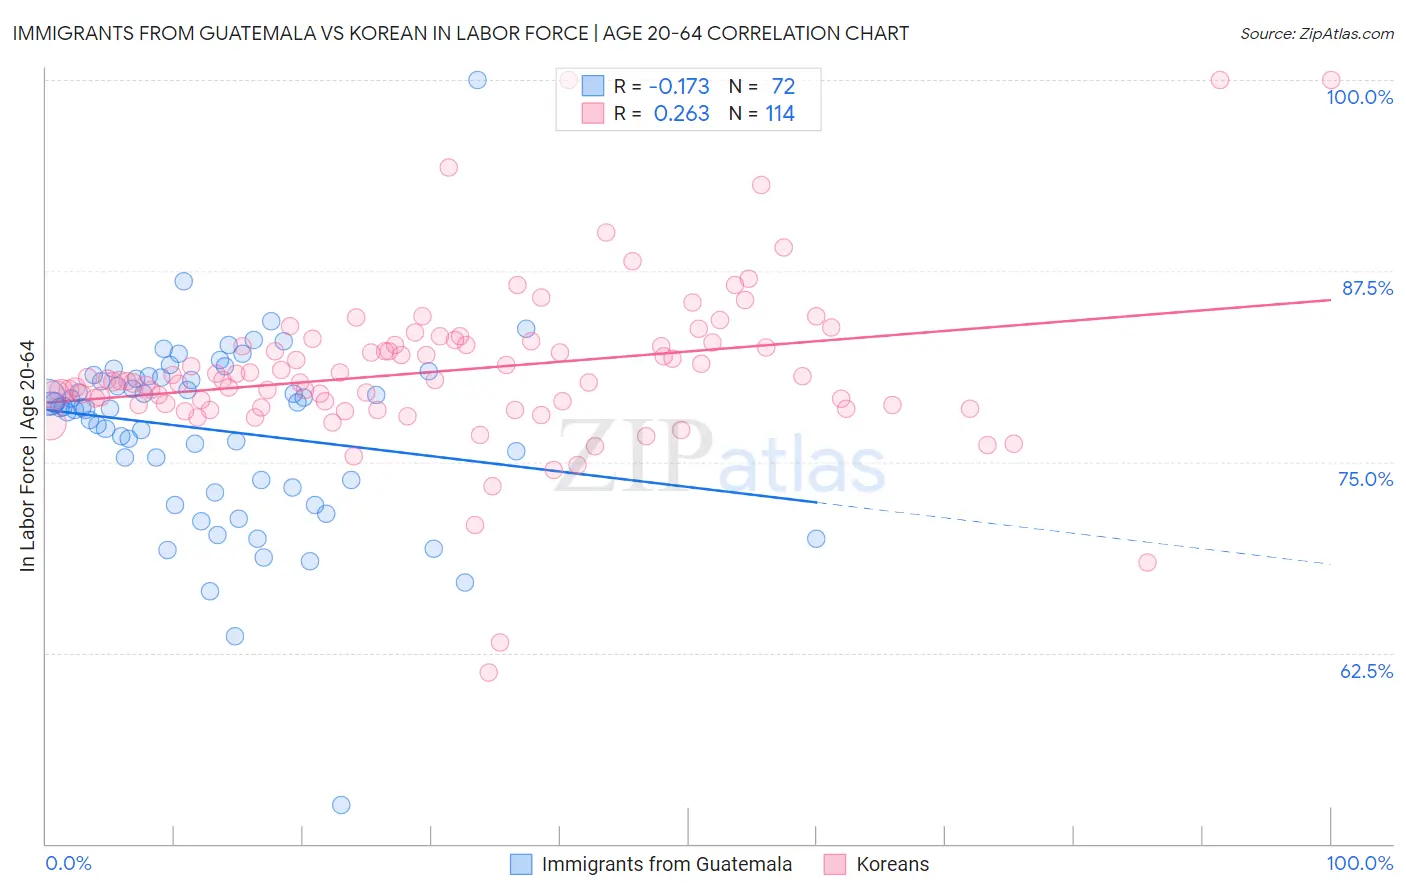
Immigrants from Guatemala vs Korean In Labor Force | Age 20-64 Correlation Chart
The statistical analysis conducted on geographies consisting of 377,275,045 people shows a poor negative correlation between the proportion of Immigrants from Guatemala and labor force participation rate among population between the ages 20 and 64 in the United States with a correlation coefficient (R) of -0.173 and weighted average of 78.7%. Similarly, the statistical analysis conducted on geographies consisting of 510,967,467 people shows a weak positive correlation between the proportion of Koreans and labor force participation rate among population between the ages 20 and 64 in the United States with a correlation coefficient (R) of 0.263 and weighted average of 79.8%, a difference of 1.4%.
In Labor Force | Age 20-64 Correlation Summary
| Measurement | Immigrants from Guatemala | Korean |
| Minimum | 52.5% | 61.2% |
| Maximum | 100.0% | 100.0% |
| Range | 47.5% | 38.8% |
| Mean | 77.1% | 81.0% |
| Median | 78.6% | 80.3% |
| Interquartile 25% (IQ1) | 73.6% | 78.7% |
| Interquartile 75% (IQ3) | 80.5% | 82.7% |
| Interquartile Range (IQR) | 6.9% | 4.0% |
| Standard Deviation (Sample) | 6.2% | 5.4% |
| Standard Deviation (Population) | 6.2% | 5.4% |
Similar Demographics by In Labor Force | Age 20-64
Demographics Similar to Immigrants from Guatemala by In Labor Force | Age 20-64
In terms of in labor force | age 20-64, the demographic groups most similar to Immigrants from Guatemala are Guatemalan (78.7%, a difference of 0.0%), Hawaiian (78.7%, a difference of 0.020%), Celtic (78.7%, a difference of 0.020%), Tsimshian (78.7%, a difference of 0.030%), and Basque (78.7%, a difference of 0.040%).
| Demographics | Rating | Rank | In Labor Force | Age 20-64 |
| Barbadians | 0.7 /100 | #251 | Tragic 78.8% |
| Immigrants | Honduras | 0.6 /100 | #252 | Tragic 78.7% |
| Basques | 0.5 /100 | #253 | Tragic 78.7% |
| Immigrants | Lebanon | 0.5 /100 | #254 | Tragic 78.7% |
| Hawaiians | 0.5 /100 | #255 | Tragic 78.7% |
| Celtics | 0.5 /100 | #256 | Tragic 78.7% |
| Guatemalans | 0.4 /100 | #257 | Tragic 78.7% |
| Immigrants | Guatemala | 0.4 /100 | #258 | Tragic 78.7% |
| Tsimshian | 0.4 /100 | #259 | Tragic 78.7% |
| Immigrants | Fiji | 0.3 /100 | #260 | Tragic 78.6% |
| Whites/Caucasians | 0.2 /100 | #261 | Tragic 78.5% |
| Fijians | 0.1 /100 | #262 | Tragic 78.4% |
| Pennsylvania Germans | 0.1 /100 | #263 | Tragic 78.4% |
| Spaniards | 0.1 /100 | #264 | Tragic 78.4% |
| British West Indians | 0.1 /100 | #265 | Tragic 78.4% |
Demographics Similar to Koreans by In Labor Force | Age 20-64
In terms of in labor force | age 20-64, the demographic groups most similar to Koreans are Immigrants from Israel (79.8%, a difference of 0.0%), Slovak (79.8%, a difference of 0.0%), Immigrants from Sweden (79.8%, a difference of 0.0%), Pakistani (79.8%, a difference of 0.0%), and Immigrants from South Eastern Asia (79.8%, a difference of 0.010%).
| Demographics | Rating | Rank | In Labor Force | Age 20-64 |
| Immigrants | Ukraine | 86.5 /100 | #137 | Excellent 79.9% |
| Immigrants | Nigeria | 86.4 /100 | #138 | Excellent 79.9% |
| Immigrants | Spain | 83.9 /100 | #139 | Excellent 79.8% |
| Immigrants | South Eastern Asia | 80.4 /100 | #140 | Excellent 79.8% |
| Immigrants | Israel | 80.0 /100 | #141 | Good 79.8% |
| Slovaks | 79.9 /100 | #142 | Good 79.8% |
| Immigrants | Sweden | 79.7 /100 | #143 | Good 79.8% |
| Koreans | 79.6 /100 | #144 | Good 79.8% |
| Pakistanis | 79.3 /100 | #145 | Good 79.8% |
| Immigrants | Southern Europe | 78.9 /100 | #146 | Good 79.8% |
| Immigrants | Philippines | 78.0 /100 | #147 | Good 79.8% |
| Romanians | 77.6 /100 | #148 | Good 79.8% |
| Icelanders | 75.1 /100 | #149 | Good 79.7% |
| Costa Ricans | 72.4 /100 | #150 | Good 79.7% |
| Scandinavians | 72.0 /100 | #151 | Good 79.7% |