Immigrants from China vs Immigrants from Austria In Labor Force | Age 45-54
COMPARE
Immigrants from China
Immigrants from Austria
In Labor Force | Age 45-54
In Labor Force | Age 45-54 Comparison
Immigrants from China
Immigrants from Austria
83.2%
IN LABOR FORCE | AGE 45-54
90.9/ 100
METRIC RATING
117th/ 347
METRIC RANK
82.9%
IN LABOR FORCE | AGE 45-54
64.6/ 100
METRIC RATING
159th/ 347
METRIC RANK
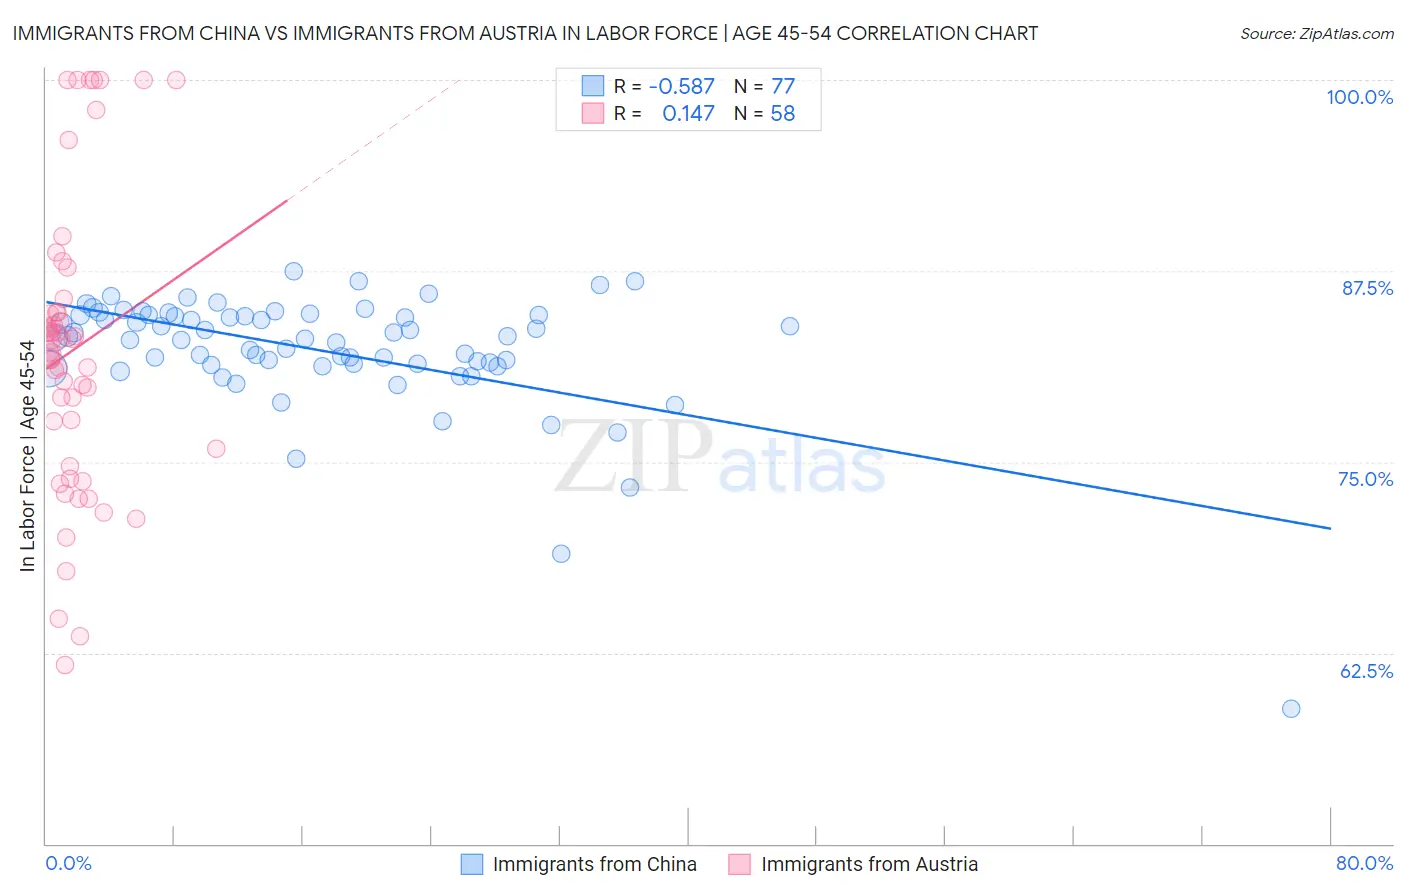
Immigrants from China vs Immigrants from Austria In Labor Force | Age 45-54 Correlation Chart
The statistical analysis conducted on geographies consisting of 456,555,548 people shows a substantial negative correlation between the proportion of Immigrants from China and labor force participation rate among population between the ages 45 and 54 in the United States with a correlation coefficient (R) of -0.587 and weighted average of 83.2%. Similarly, the statistical analysis conducted on geographies consisting of 167,955,252 people shows a poor positive correlation between the proportion of Immigrants from Austria and labor force participation rate among population between the ages 45 and 54 in the United States with a correlation coefficient (R) of 0.147 and weighted average of 82.9%, a difference of 0.37%.
In Labor Force | Age 45-54 Correlation Summary
| Measurement | Immigrants from China | Immigrants from Austria |
| Minimum | 58.8% | 61.7% |
| Maximum | 87.5% | 100.0% |
| Range | 28.7% | 38.3% |
| Mean | 82.3% | 82.3% |
| Median | 83.1% | 82.5% |
| Interquartile 25% (IQ1) | 81.4% | 75.9% |
| Interquartile 75% (IQ3) | 84.6% | 84.8% |
| Interquartile Range (IQR) | 3.3% | 8.9% |
| Standard Deviation (Sample) | 4.1% | 9.5% |
| Standard Deviation (Population) | 4.0% | 9.5% |
Similar Demographics by In Labor Force | Age 45-54
Demographics Similar to Immigrants from China by In Labor Force | Age 45-54
In terms of in labor force | age 45-54, the demographic groups most similar to Immigrants from China are Immigrants from Malaysia (83.2%, a difference of 0.010%), Immigrants from Europe (83.2%, a difference of 0.010%), Assyrian/Chaldean/Syriac (83.2%, a difference of 0.020%), Immigrants from Chile (83.2%, a difference of 0.020%), and Immigrants from Uruguay (83.2%, a difference of 0.020%).
| Demographics | Rating | Rank | In Labor Force | Age 45-54 |
| Immigrants | Africa | 92.6 /100 | #110 | Exceptional 83.2% |
| Immigrants | Italy | 92.5 /100 | #111 | Exceptional 83.2% |
| Immigrants | Afghanistan | 92.4 /100 | #112 | Exceptional 83.2% |
| Immigrants | Albania | 91.8 /100 | #113 | Exceptional 83.2% |
| Assyrians/Chaldeans/Syriacs | 91.7 /100 | #114 | Exceptional 83.2% |
| Immigrants | Chile | 91.6 /100 | #115 | Exceptional 83.2% |
| Immigrants | Malaysia | 91.4 /100 | #116 | Exceptional 83.2% |
| Immigrants | China | 90.9 /100 | #117 | Exceptional 83.2% |
| Immigrants | Europe | 90.7 /100 | #118 | Exceptional 83.2% |
| Immigrants | Uruguay | 90.2 /100 | #119 | Exceptional 83.2% |
| Immigrants | Russia | 90.1 /100 | #120 | Exceptional 83.2% |
| Uruguayans | 89.4 /100 | #121 | Excellent 83.1% |
| Immigrants | Vietnam | 88.9 /100 | #122 | Excellent 83.1% |
| Tongans | 88.2 /100 | #123 | Excellent 83.1% |
| Bermudans | 88.0 /100 | #124 | Excellent 83.1% |
Demographics Similar to Immigrants from Austria by In Labor Force | Age 45-54
In terms of in labor force | age 45-54, the demographic groups most similar to Immigrants from Austria are Laotian (82.9%, a difference of 0.020%), South American Indian (82.9%, a difference of 0.020%), Immigrants from Southern Europe (82.9%, a difference of 0.030%), Haitian (82.8%, a difference of 0.030%), and Dutch (82.8%, a difference of 0.030%).
| Demographics | Rating | Rank | In Labor Force | Age 45-54 |
| Slavs | 71.5 /100 | #152 | Good 82.9% |
| Immigrants | Indonesia | 70.6 /100 | #153 | Good 82.9% |
| Immigrants | Ghana | 70.3 /100 | #154 | Good 82.9% |
| Immigrants | Philippines | 69.0 /100 | #155 | Good 82.9% |
| Immigrants | Saudi Arabia | 68.8 /100 | #156 | Good 82.9% |
| Immigrants | Australia | 68.2 /100 | #157 | Good 82.9% |
| Immigrants | Southern Europe | 67.8 /100 | #158 | Good 82.9% |
| Immigrants | Austria | 64.6 /100 | #159 | Good 82.9% |
| Laotians | 62.8 /100 | #160 | Good 82.9% |
| South American Indians | 62.2 /100 | #161 | Good 82.9% |
| Haitians | 61.8 /100 | #162 | Good 82.8% |
| Dutch | 61.7 /100 | #163 | Good 82.8% |
| German Russians | 61.3 /100 | #164 | Good 82.8% |
| Immigrants | Sudan | 59.9 /100 | #165 | Average 82.8% |
| Immigrants | South Eastern Asia | 57.4 /100 | #166 | Average 82.8% |