Immigrants from China vs Immigrants from Israel In Labor Force | Age 25-29
COMPARE
Immigrants from China
Immigrants from Israel
In Labor Force | Age 25-29
In Labor Force | Age 25-29 Comparison
Immigrants from China
Immigrants from Israel
84.6%
IN LABOR FORCE | AGE 25-29
45.7/ 100
METRIC RATING
177th/ 347
METRIC RANK
84.4%
IN LABOR FORCE | AGE 25-29
20.8/ 100
METRIC RATING
195th/ 347
METRIC RANK
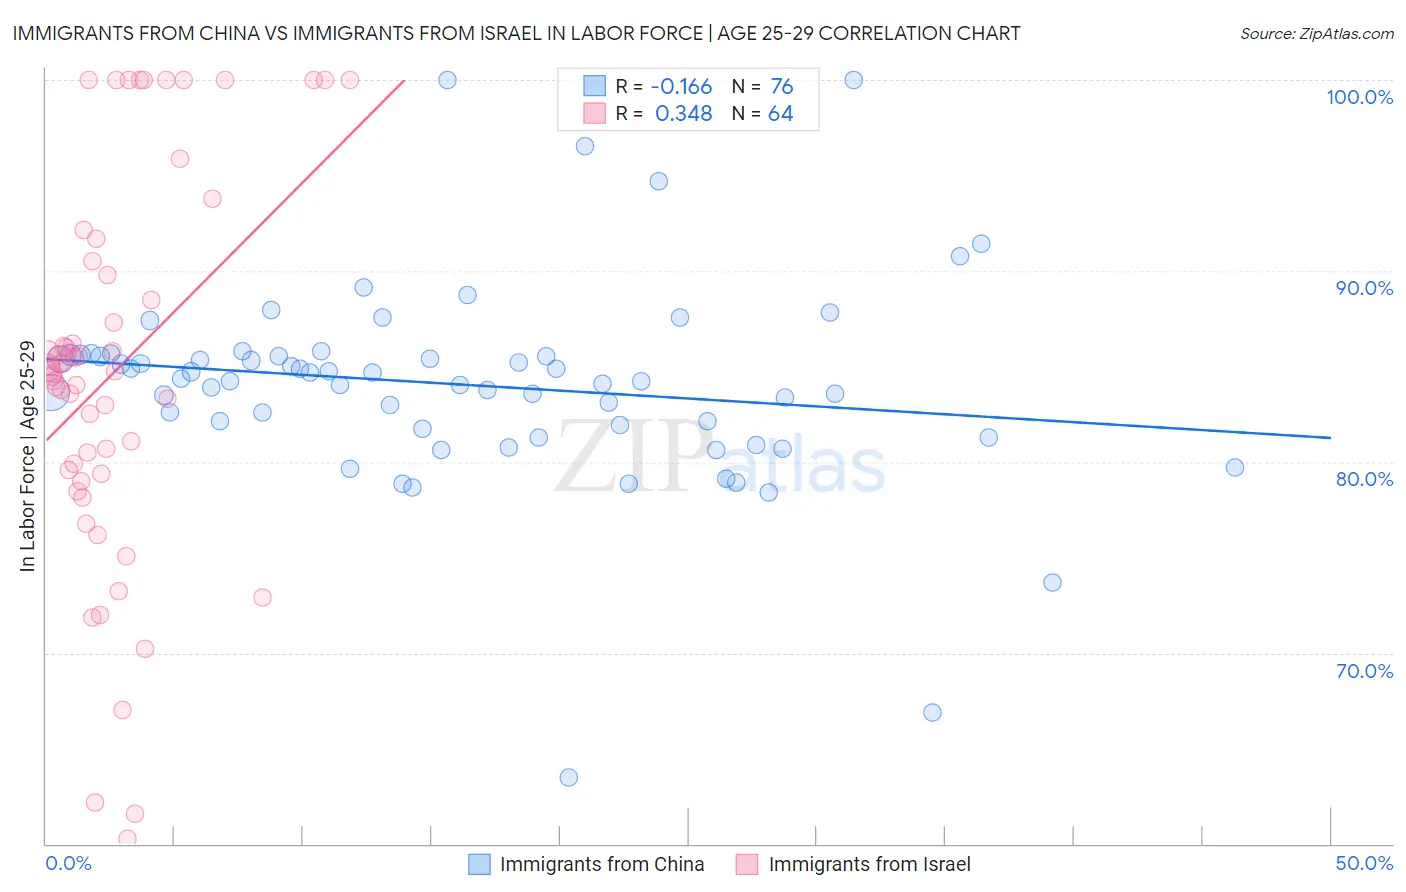
Immigrants from China vs Immigrants from Israel In Labor Force | Age 25-29 Correlation Chart
The statistical analysis conducted on geographies consisting of 456,821,208 people shows a poor negative correlation between the proportion of Immigrants from China and labor force participation rate among population between the ages 25 and 29 in the United States with a correlation coefficient (R) of -0.166 and weighted average of 84.6%. Similarly, the statistical analysis conducted on geographies consisting of 209,997,538 people shows a mild positive correlation between the proportion of Immigrants from Israel and labor force participation rate among population between the ages 25 and 29 in the United States with a correlation coefficient (R) of 0.348 and weighted average of 84.4%, a difference of 0.22%.
In Labor Force | Age 25-29 Correlation Summary
| Measurement | Immigrants from China | Immigrants from Israel |
| Minimum | 63.5% | 60.3% |
| Maximum | 100.0% | 100.0% |
| Range | 36.5% | 39.7% |
| Mean | 84.0% | 84.7% |
| Median | 84.3% | 84.8% |
| Interquartile 25% (IQ1) | 81.8% | 79.5% |
| Interquartile 75% (IQ3) | 85.6% | 90.2% |
| Interquartile Range (IQR) | 3.7% | 10.7% |
| Standard Deviation (Sample) | 5.4% | 9.9% |
| Standard Deviation (Population) | 5.3% | 9.9% |
Demographics Similar to Immigrants from China and Immigrants from Israel by In Labor Force | Age 25-29
In terms of in labor force | age 25-29, the demographic groups most similar to Immigrants from China are Immigrants from Thailand (84.6%, a difference of 0.0%), Malaysian (84.6%, a difference of 0.010%), Immigrants from Argentina (84.6%, a difference of 0.010%), Immigrants from South America (84.6%, a difference of 0.020%), and Immigrants from Norway (84.6%, a difference of 0.030%). Similarly, the demographic groups most similar to Immigrants from Israel are Portuguese (84.4%, a difference of 0.010%), Immigrants from South Eastern Asia (84.4%, a difference of 0.010%), South American Indian (84.5%, a difference of 0.040%), English (84.5%, a difference of 0.050%), and Zimbabwean (84.5%, a difference of 0.080%).
| Demographics | Rating | Rank | In Labor Force | Age 25-29 |
| Malaysians | 46.8 /100 | #176 | Average 84.6% |
| Immigrants | China | 45.7 /100 | #177 | Average 84.6% |
| Immigrants | Thailand | 45.2 /100 | #178 | Average 84.6% |
| Immigrants | Argentina | 44.0 /100 | #179 | Average 84.6% |
| Immigrants | South America | 42.9 /100 | #180 | Average 84.6% |
| Immigrants | Norway | 41.9 /100 | #181 | Average 84.6% |
| Europeans | 40.3 /100 | #182 | Average 84.6% |
| Scottish | 40.1 /100 | #183 | Average 84.6% |
| Immigrants | Kuwait | 38.2 /100 | #184 | Fair 84.6% |
| Immigrants | Denmark | 37.0 /100 | #185 | Fair 84.6% |
| Immigrants | Belgium | 35.0 /100 | #186 | Fair 84.6% |
| Immigrants | Portugal | 34.7 /100 | #187 | Fair 84.6% |
| Immigrants | Ukraine | 33.7 /100 | #188 | Fair 84.5% |
| Moroccans | 32.6 /100 | #189 | Fair 84.5% |
| Welsh | 31.1 /100 | #190 | Fair 84.5% |
| Zimbabweans | 28.7 /100 | #191 | Fair 84.5% |
| English | 25.8 /100 | #192 | Fair 84.5% |
| South American Indians | 25.0 /100 | #193 | Fair 84.5% |
| Portuguese | 21.2 /100 | #194 | Fair 84.4% |
| Immigrants | Israel | 20.8 /100 | #195 | Fair 84.4% |
| Immigrants | South Eastern Asia | 19.5 /100 | #196 | Poor 84.4% |