Immigrants from Saudi Arabia vs Menominee In Labor Force | Age 45-54
COMPARE
Immigrants from Saudi Arabia
Menominee
In Labor Force | Age 45-54
In Labor Force | Age 45-54 Comparison
Immigrants from Saudi Arabia
Menominee
82.9%
IN LABOR FORCE | AGE 45-54
68.8/ 100
METRIC RATING
156th/ 347
METRIC RANK
77.4%
IN LABOR FORCE | AGE 45-54
0.0/ 100
METRIC RATING
332nd/ 347
METRIC RANK
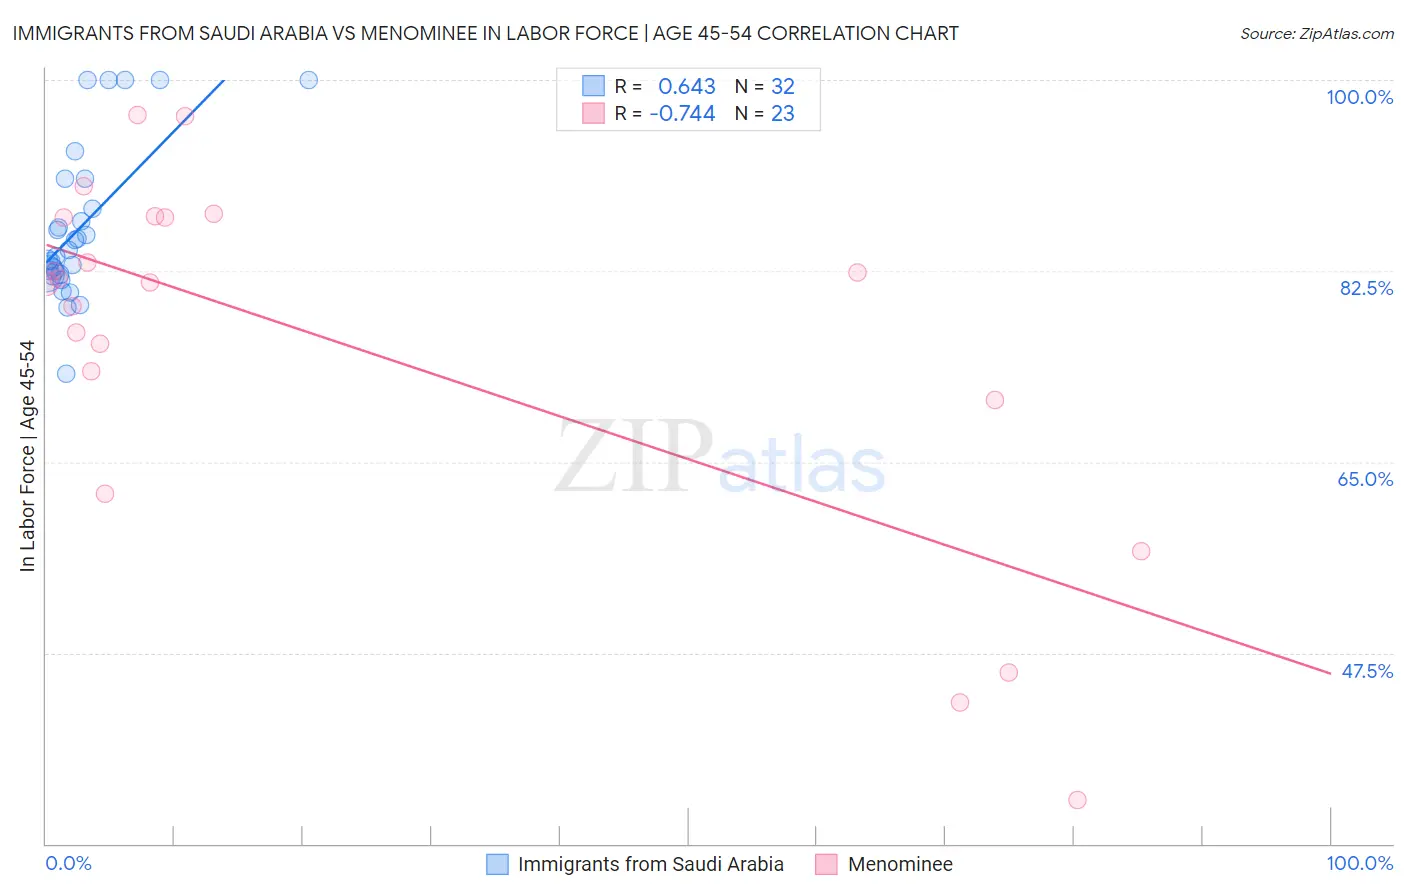
Immigrants from Saudi Arabia vs Menominee In Labor Force | Age 45-54 Correlation Chart
The statistical analysis conducted on geographies consisting of 164,195,030 people shows a significant positive correlation between the proportion of Immigrants from Saudi Arabia and labor force participation rate among population between the ages 45 and 54 in the United States with a correlation coefficient (R) of 0.643 and weighted average of 82.9%. Similarly, the statistical analysis conducted on geographies consisting of 45,777,282 people shows a strong negative correlation between the proportion of Menominee and labor force participation rate among population between the ages 45 and 54 in the United States with a correlation coefficient (R) of -0.744 and weighted average of 77.4%, a difference of 7.1%.
In Labor Force | Age 45-54 Correlation Summary
| Measurement | Immigrants from Saudi Arabia | Menominee |
| Minimum | 73.1% | 34.0% |
| Maximum | 100.0% | 96.8% |
| Range | 26.9% | 62.8% |
| Mean | 86.5% | 75.8% |
| Median | 84.1% | 81.4% |
| Interquartile 25% (IQ1) | 82.2% | 70.7% |
| Interquartile 75% (IQ3) | 89.5% | 87.4% |
| Interquartile Range (IQR) | 7.3% | 16.7% |
| Standard Deviation (Sample) | 7.0% | 16.8% |
| Standard Deviation (Population) | 6.9% | 16.4% |
Similar Demographics by In Labor Force | Age 45-54
Demographics Similar to Immigrants from Saudi Arabia by In Labor Force | Age 45-54
In terms of in labor force | age 45-54, the demographic groups most similar to Immigrants from Saudi Arabia are Immigrants from Philippines (82.9%, a difference of 0.0%), Immigrants from Australia (82.9%, a difference of 0.010%), Immigrants from Southern Europe (82.9%, a difference of 0.010%), Immigrants from Indonesia (82.9%, a difference of 0.020%), and Immigrants from Ghana (82.9%, a difference of 0.020%).
| Demographics | Rating | Rank | In Labor Force | Age 45-54 |
| Immigrants | Sweden | 73.3 /100 | #149 | Good 82.9% |
| Immigrants | Netherlands | 72.6 /100 | #150 | Good 82.9% |
| Koreans | 71.9 /100 | #151 | Good 82.9% |
| Slavs | 71.5 /100 | #152 | Good 82.9% |
| Immigrants | Indonesia | 70.6 /100 | #153 | Good 82.9% |
| Immigrants | Ghana | 70.3 /100 | #154 | Good 82.9% |
| Immigrants | Philippines | 69.0 /100 | #155 | Good 82.9% |
| Immigrants | Saudi Arabia | 68.8 /100 | #156 | Good 82.9% |
| Immigrants | Australia | 68.2 /100 | #157 | Good 82.9% |
| Immigrants | Southern Europe | 67.8 /100 | #158 | Good 82.9% |
| Immigrants | Austria | 64.6 /100 | #159 | Good 82.9% |
| Laotians | 62.8 /100 | #160 | Good 82.9% |
| South American Indians | 62.2 /100 | #161 | Good 82.9% |
| Haitians | 61.8 /100 | #162 | Good 82.8% |
| Dutch | 61.7 /100 | #163 | Good 82.8% |
Demographics Similar to Menominee by In Labor Force | Age 45-54
In terms of in labor force | age 45-54, the demographic groups most similar to Menominee are Tsimshian (77.4%, a difference of 0.030%), Cheyenne (77.6%, a difference of 0.18%), Native/Alaskan (77.1%, a difference of 0.36%), Apache (77.1%, a difference of 0.36%), and Creek (77.7%, a difference of 0.41%).
| Demographics | Rating | Rank | In Labor Force | Age 45-54 |
| Choctaw | 0.0 /100 | #325 | Tragic 78.2% |
| Seminole | 0.0 /100 | #326 | Tragic 78.1% |
| Cajuns | 0.0 /100 | #327 | Tragic 78.1% |
| Sioux | 0.0 /100 | #328 | Tragic 78.0% |
| Creek | 0.0 /100 | #329 | Tragic 77.7% |
| Cheyenne | 0.0 /100 | #330 | Tragic 77.6% |
| Tsimshian | 0.0 /100 | #331 | Tragic 77.4% |
| Menominee | 0.0 /100 | #332 | Tragic 77.4% |
| Natives/Alaskans | 0.0 /100 | #333 | Tragic 77.1% |
| Apache | 0.0 /100 | #334 | Tragic 77.1% |
| Arapaho | 0.0 /100 | #335 | Tragic 77.1% |
| Paiute | 0.0 /100 | #336 | Tragic 76.7% |
| Ute | 0.0 /100 | #337 | Tragic 76.6% |
| Yuman | 0.0 /100 | #338 | Tragic 76.3% |
| Puerto Ricans | 0.0 /100 | #339 | Tragic 75.9% |