Immigrants from Caribbean vs Bulgarian 10th Grade
COMPARE
Immigrants from Caribbean
Bulgarian
10th Grade
10th Grade Comparison
Immigrants from Caribbean
Bulgarians
90.6%
10TH GRADE
0.0/ 100
METRIC RATING
315th/ 347
METRIC RANK
95.4%
10TH GRADE
100.0/ 100
METRIC RATING
29th/ 347
METRIC RANK
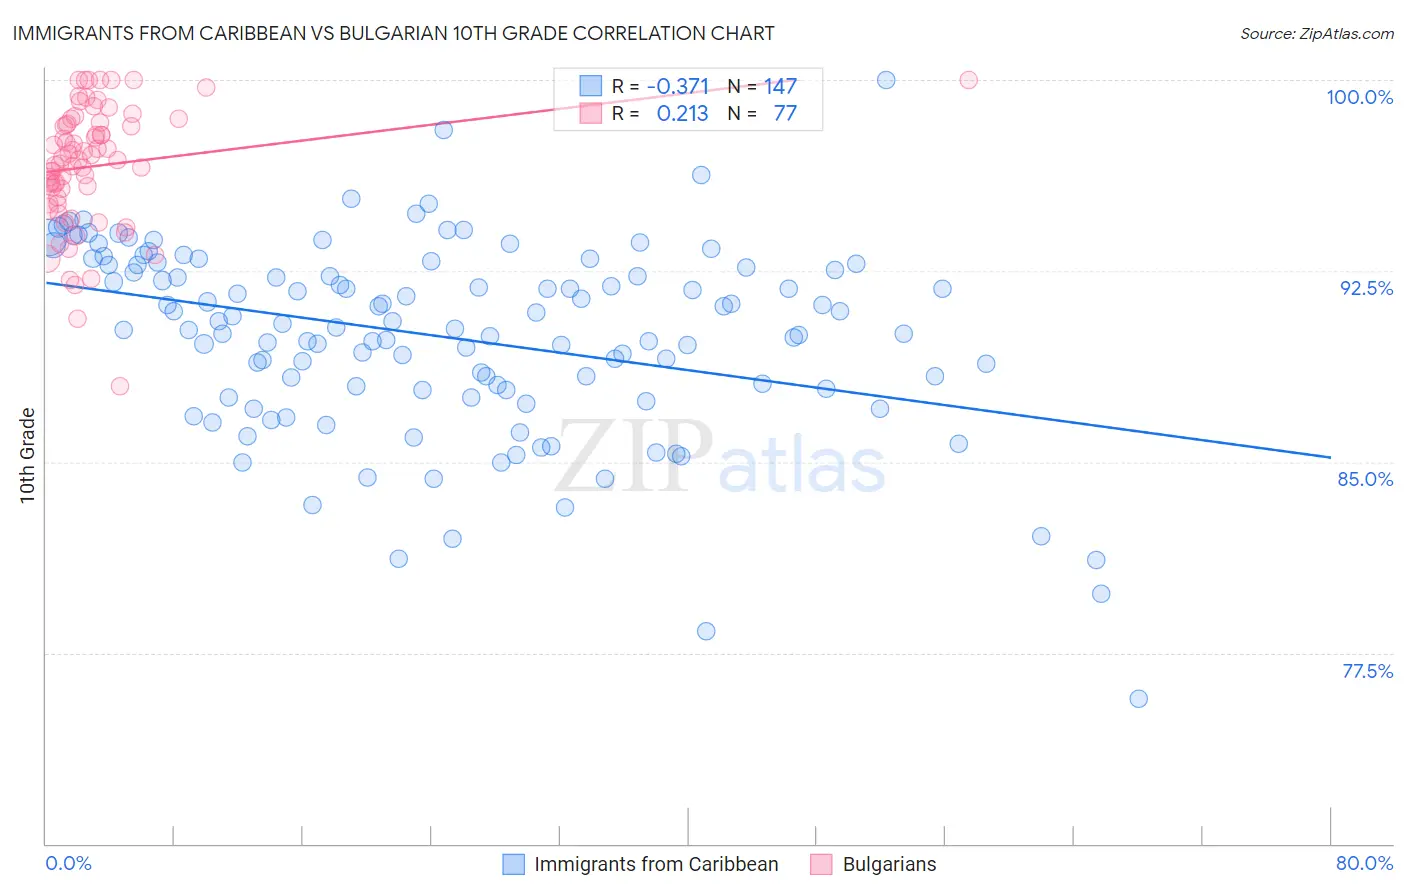
Immigrants from Caribbean vs Bulgarian 10th Grade Correlation Chart
The statistical analysis conducted on geographies consisting of 450,064,654 people shows a mild negative correlation between the proportion of Immigrants from Caribbean and percentage of population with at least 10th grade education in the United States with a correlation coefficient (R) of -0.371 and weighted average of 90.6%. Similarly, the statistical analysis conducted on geographies consisting of 205,632,748 people shows a weak positive correlation between the proportion of Bulgarians and percentage of population with at least 10th grade education in the United States with a correlation coefficient (R) of 0.213 and weighted average of 95.4%, a difference of 5.3%.
10th Grade Correlation Summary
| Measurement | Immigrants from Caribbean | Bulgarian |
| Minimum | 75.7% | 88.0% |
| Maximum | 100.0% | 100.0% |
| Range | 24.3% | 12.0% |
| Mean | 89.9% | 96.6% |
| Median | 90.3% | 96.8% |
| Interquartile 25% (IQ1) | 87.8% | 95.3% |
| Interquartile 75% (IQ3) | 92.7% | 98.3% |
| Interquartile Range (IQR) | 4.9% | 3.0% |
| Standard Deviation (Sample) | 3.8% | 2.4% |
| Standard Deviation (Population) | 3.8% | 2.4% |
Similar Demographics by 10th Grade
Demographics Similar to Immigrants from Caribbean by 10th Grade
In terms of 10th grade, the demographic groups most similar to Immigrants from Caribbean are Ecuadorian (90.6%, a difference of 0.010%), Nepalese (90.7%, a difference of 0.080%), Cape Verdean (90.8%, a difference of 0.16%), Immigrants from Ecuador (90.4%, a difference of 0.18%), and Immigrants from Portugal (90.8%, a difference of 0.19%).
| Demographics | Rating | Rank | 10th Grade |
| Immigrants | Bangladesh | 0.0 /100 | #308 | Tragic 91.0% |
| Immigrants | Immigrants | 0.0 /100 | #309 | Tragic 91.0% |
| Vietnamese | 0.0 /100 | #310 | Tragic 90.9% |
| Immigrants | Cambodia | 0.0 /100 | #311 | Tragic 90.9% |
| Immigrants | Portugal | 0.0 /100 | #312 | Tragic 90.8% |
| Cape Verdeans | 0.0 /100 | #313 | Tragic 90.8% |
| Nepalese | 0.0 /100 | #314 | Tragic 90.7% |
| Immigrants | Caribbean | 0.0 /100 | #315 | Tragic 90.6% |
| Ecuadorians | 0.0 /100 | #316 | Tragic 90.6% |
| Immigrants | Ecuador | 0.0 /100 | #317 | Tragic 90.4% |
| Immigrants | Cuba | 0.0 /100 | #318 | Tragic 90.2% |
| Nicaraguans | 0.0 /100 | #319 | Tragic 90.2% |
| Houma | 0.0 /100 | #320 | Tragic 90.2% |
| Belizeans | 0.0 /100 | #321 | Tragic 90.2% |
| Tohono O'odham | 0.0 /100 | #322 | Tragic 90.1% |
Demographics Similar to Bulgarians by 10th Grade
In terms of 10th grade, the demographic groups most similar to Bulgarians are Alaskan Athabascan (95.4%, a difference of 0.030%), Luxembourger (95.4%, a difference of 0.030%), Welsh (95.5%, a difference of 0.050%), Belgian (95.4%, a difference of 0.050%), and European (95.5%, a difference of 0.070%).
| Demographics | Rating | Rank | 10th Grade |
| Eastern Europeans | 100.0 /100 | #22 | Exceptional 95.5% |
| Czechs | 100.0 /100 | #23 | Exceptional 95.5% |
| Europeans | 100.0 /100 | #24 | Exceptional 95.5% |
| Maltese | 100.0 /100 | #25 | Exceptional 95.5% |
| Welsh | 100.0 /100 | #26 | Exceptional 95.5% |
| Alaskan Athabascans | 100.0 /100 | #27 | Exceptional 95.4% |
| Luxembourgers | 100.0 /100 | #28 | Exceptional 95.4% |
| Bulgarians | 100.0 /100 | #29 | Exceptional 95.4% |
| Belgians | 100.0 /100 | #30 | Exceptional 95.4% |
| Iranians | 100.0 /100 | #31 | Exceptional 95.3% |
| Hungarians | 100.0 /100 | #32 | Exceptional 95.3% |
| French | 100.0 /100 | #33 | Exceptional 95.3% |
| British | 99.9 /100 | #34 | Exceptional 95.3% |
| Estonians | 99.9 /100 | #35 | Exceptional 95.3% |
| Immigrants | India | 99.9 /100 | #36 | Exceptional 95.3% |