Immigrants from Cameroon vs Yup'ik In Labor Force | Age 20-64
COMPARE
Immigrants from Cameroon
Yup'ik
In Labor Force | Age 20-64
In Labor Force | Age 20-64 Comparison
Immigrants from Cameroon
Yup'ik
81.6%
IN LABOR FORCE | AGE 20-64
100.0/ 100
METRIC RATING
7th/ 347
METRIC RANK
73.2%
IN LABOR FORCE | AGE 20-64
0.0/ 100
METRIC RATING
337th/ 347
METRIC RANK
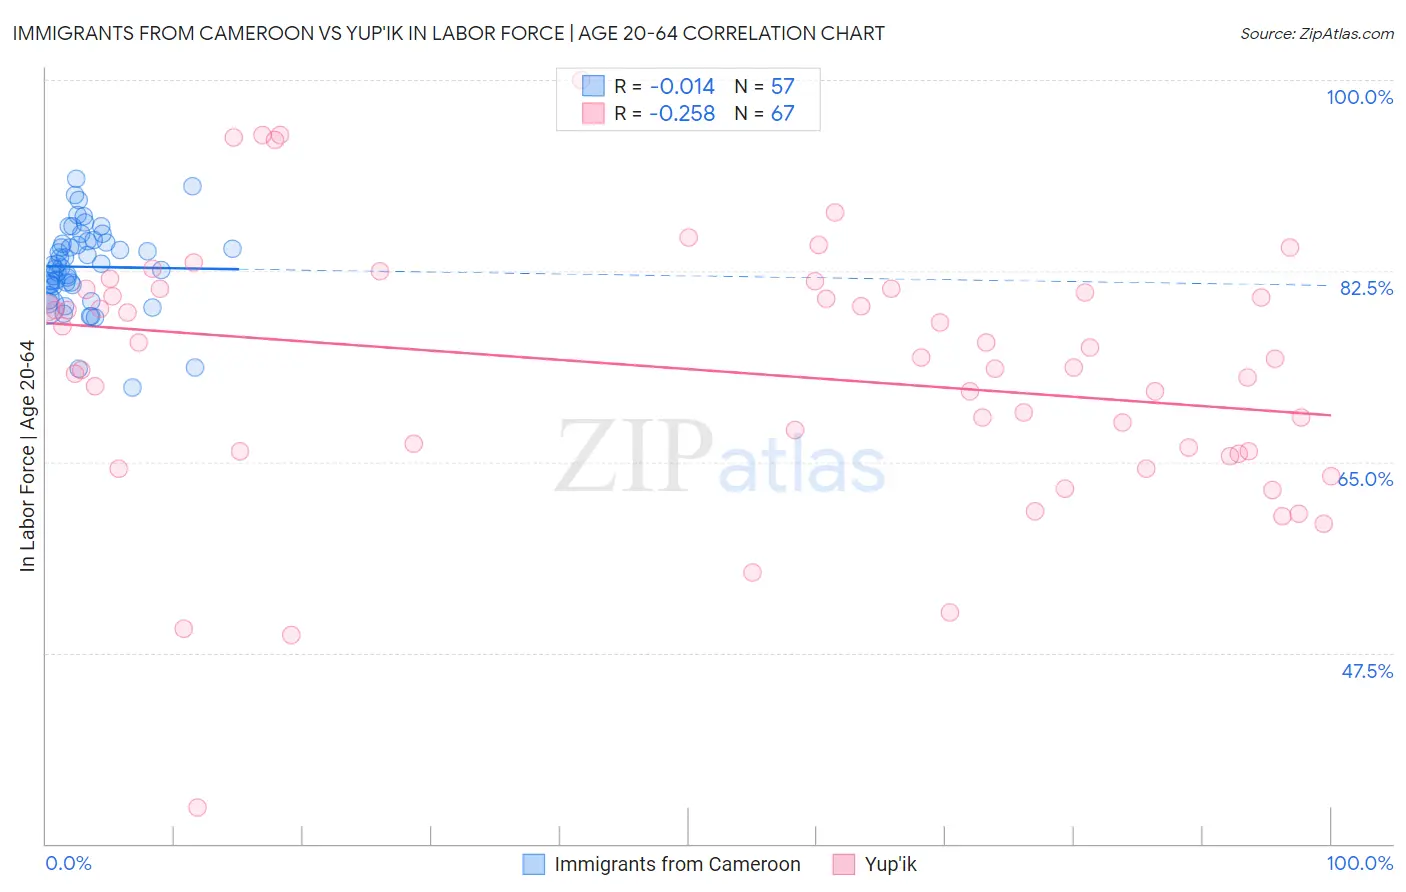
Immigrants from Cameroon vs Yup'ik In Labor Force | Age 20-64 Correlation Chart
The statistical analysis conducted on geographies consisting of 130,760,472 people shows no correlation between the proportion of Immigrants from Cameroon and labor force participation rate among population between the ages 20 and 64 in the United States with a correlation coefficient (R) of -0.014 and weighted average of 81.6%. Similarly, the statistical analysis conducted on geographies consisting of 39,964,003 people shows a weak negative correlation between the proportion of Yup'ik and labor force participation rate among population between the ages 20 and 64 in the United States with a correlation coefficient (R) of -0.258 and weighted average of 73.2%, a difference of 11.4%.
In Labor Force | Age 20-64 Correlation Summary
| Measurement | Immigrants from Cameroon | Yup'ik |
| Minimum | 71.8% | 33.3% |
| Maximum | 90.9% | 100.0% |
| Range | 19.1% | 66.7% |
| Mean | 82.9% | 73.4% |
| Median | 83.1% | 74.4% |
| Interquartile 25% (IQ1) | 81.2% | 66.0% |
| Interquartile 75% (IQ3) | 85.2% | 80.8% |
| Interquartile Range (IQR) | 4.0% | 14.8% |
| Standard Deviation (Sample) | 3.8% | 11.9% |
| Standard Deviation (Population) | 3.8% | 11.8% |
Similar Demographics by In Labor Force | Age 20-64
Demographics Similar to Immigrants from Cameroon by In Labor Force | Age 20-64
In terms of in labor force | age 20-64, the demographic groups most similar to Immigrants from Cameroon are Immigrants from Somalia (81.6%, a difference of 0.020%), Sierra Leonean (81.5%, a difference of 0.020%), Somali (81.6%, a difference of 0.040%), Immigrants from Sierra Leone (81.5%, a difference of 0.14%), and Bolivian (81.7%, a difference of 0.15%).
| Demographics | Rating | Rank | In Labor Force | Age 20-64 |
| Immigrants | Ethiopia | 100.0 /100 | #1 | Exceptional 82.1% |
| Ethiopians | 100.0 /100 | #2 | Exceptional 82.0% |
| Immigrants | Bolivia | 100.0 /100 | #3 | Exceptional 81.9% |
| Luxembourgers | 100.0 /100 | #4 | Exceptional 81.9% |
| Bolivians | 100.0 /100 | #5 | Exceptional 81.7% |
| Somalis | 100.0 /100 | #6 | Exceptional 81.6% |
| Immigrants | Cameroon | 100.0 /100 | #7 | Exceptional 81.6% |
| Immigrants | Somalia | 100.0 /100 | #8 | Exceptional 81.6% |
| Sierra Leoneans | 100.0 /100 | #9 | Exceptional 81.5% |
| Immigrants | Sierra Leone | 100.0 /100 | #10 | Exceptional 81.5% |
| Immigrants | Eastern Africa | 100.0 /100 | #11 | Exceptional 81.3% |
| Immigrants | Eritrea | 100.0 /100 | #12 | Exceptional 81.3% |
| Immigrants | India | 100.0 /100 | #13 | Exceptional 81.3% |
| Cambodians | 100.0 /100 | #14 | Exceptional 81.1% |
| Bulgarians | 100.0 /100 | #15 | Exceptional 81.1% |
Demographics Similar to Yup'ik by In Labor Force | Age 20-64
In terms of in labor force | age 20-64, the demographic groups most similar to Yup'ik are Crow (73.3%, a difference of 0.12%), Puerto Rican (73.1%, a difference of 0.21%), Ute (73.7%, a difference of 0.63%), Apache (73.7%, a difference of 0.64%), and Houma (72.7%, a difference of 0.64%).
| Demographics | Rating | Rank | In Labor Force | Age 20-64 |
| Colville | 0.0 /100 | #330 | Tragic 74.8% |
| Paiute | 0.0 /100 | #331 | Tragic 74.7% |
| Arapaho | 0.0 /100 | #332 | Tragic 74.4% |
| Natives/Alaskans | 0.0 /100 | #333 | Tragic 73.9% |
| Apache | 0.0 /100 | #334 | Tragic 73.7% |
| Ute | 0.0 /100 | #335 | Tragic 73.7% |
| Crow | 0.0 /100 | #336 | Tragic 73.3% |
| Yup'ik | 0.0 /100 | #337 | Tragic 73.2% |
| Puerto Ricans | 0.0 /100 | #338 | Tragic 73.1% |
| Houma | 0.0 /100 | #339 | Tragic 72.7% |
| Pueblo | 0.0 /100 | #340 | Tragic 72.6% |
| Immigrants | Yemen | 0.0 /100 | #341 | Tragic 72.3% |
| Yuman | 0.0 /100 | #342 | Tragic 71.7% |
| Hopi | 0.0 /100 | #343 | Tragic 71.7% |
| Lumbee | 0.0 /100 | #344 | Tragic 70.6% |