Immigrants from Cameroon vs Iraqi In Labor Force | Age 20-64
COMPARE
Immigrants from Cameroon
Iraqi
In Labor Force | Age 20-64
In Labor Force | Age 20-64 Comparison
Immigrants from Cameroon
Iraqis
81.6%
IN LABOR FORCE | AGE 20-64
100.0/ 100
METRIC RATING
7th/ 347
METRIC RANK
79.3%
IN LABOR FORCE | AGE 20-64
17.7/ 100
METRIC RATING
203rd/ 347
METRIC RANK
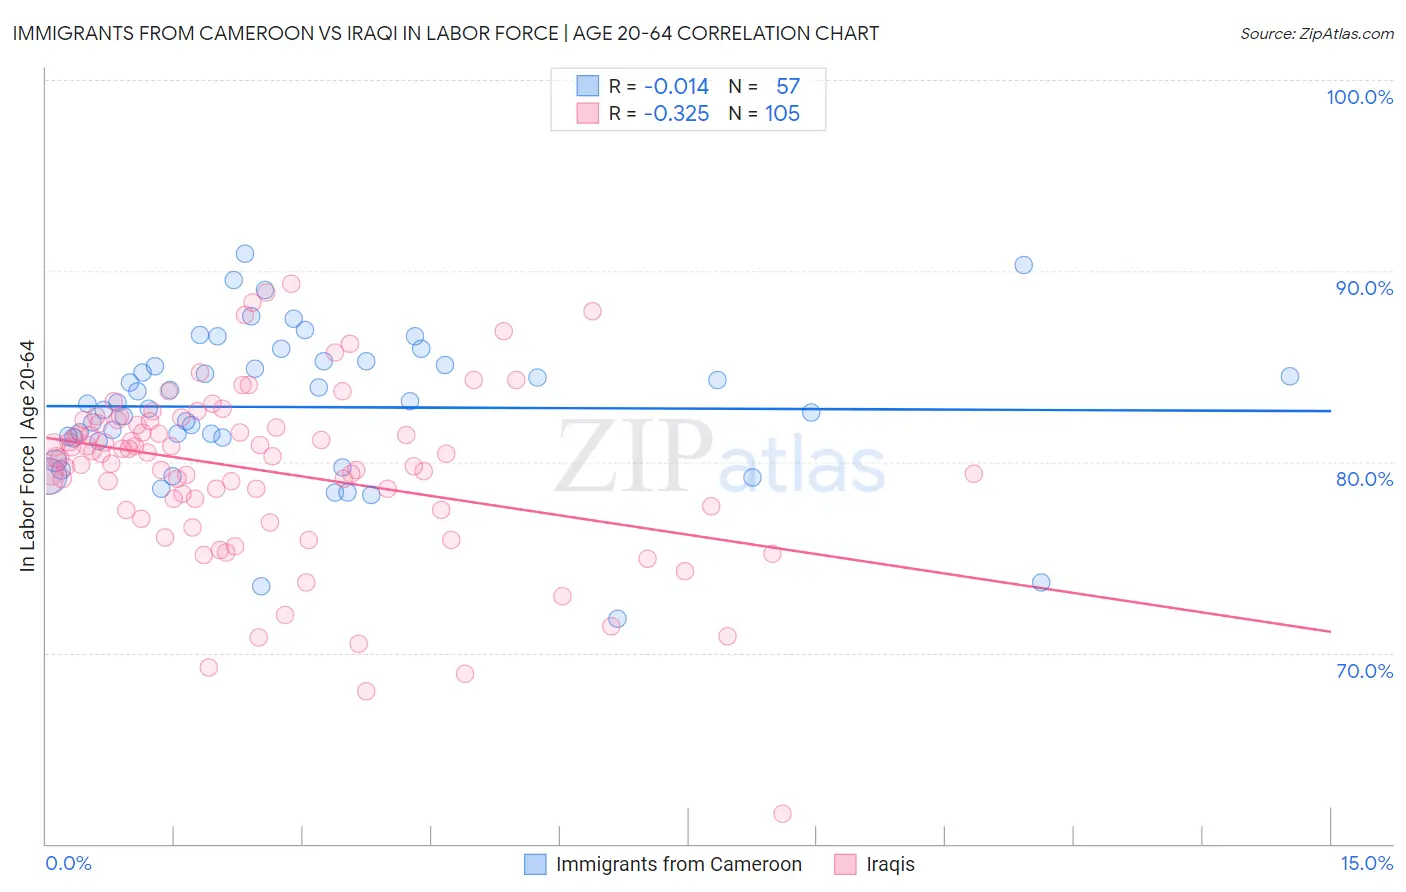
Immigrants from Cameroon vs Iraqi In Labor Force | Age 20-64 Correlation Chart
The statistical analysis conducted on geographies consisting of 130,760,472 people shows no correlation between the proportion of Immigrants from Cameroon and labor force participation rate among population between the ages 20 and 64 in the United States with a correlation coefficient (R) of -0.014 and weighted average of 81.6%. Similarly, the statistical analysis conducted on geographies consisting of 170,648,723 people shows a mild negative correlation between the proportion of Iraqis and labor force participation rate among population between the ages 20 and 64 in the United States with a correlation coefficient (R) of -0.325 and weighted average of 79.3%, a difference of 2.8%.
In Labor Force | Age 20-64 Correlation Summary
| Measurement | Immigrants from Cameroon | Iraqi |
| Minimum | 71.8% | 61.6% |
| Maximum | 90.9% | 89.3% |
| Range | 19.1% | 27.7% |
| Mean | 82.9% | 79.6% |
| Median | 83.1% | 80.3% |
| Interquartile 25% (IQ1) | 81.2% | 77.6% |
| Interquartile 75% (IQ3) | 85.2% | 82.1% |
| Interquartile Range (IQR) | 4.0% | 4.5% |
| Standard Deviation (Sample) | 3.8% | 4.6% |
| Standard Deviation (Population) | 3.8% | 4.6% |
Similar Demographics by In Labor Force | Age 20-64
Demographics Similar to Immigrants from Cameroon by In Labor Force | Age 20-64
In terms of in labor force | age 20-64, the demographic groups most similar to Immigrants from Cameroon are Immigrants from Somalia (81.6%, a difference of 0.020%), Sierra Leonean (81.5%, a difference of 0.020%), Somali (81.6%, a difference of 0.040%), Immigrants from Sierra Leone (81.5%, a difference of 0.14%), and Bolivian (81.7%, a difference of 0.15%).
| Demographics | Rating | Rank | In Labor Force | Age 20-64 |
| Immigrants | Ethiopia | 100.0 /100 | #1 | Exceptional 82.1% |
| Ethiopians | 100.0 /100 | #2 | Exceptional 82.0% |
| Immigrants | Bolivia | 100.0 /100 | #3 | Exceptional 81.9% |
| Luxembourgers | 100.0 /100 | #4 | Exceptional 81.9% |
| Bolivians | 100.0 /100 | #5 | Exceptional 81.7% |
| Somalis | 100.0 /100 | #6 | Exceptional 81.6% |
| Immigrants | Cameroon | 100.0 /100 | #7 | Exceptional 81.6% |
| Immigrants | Somalia | 100.0 /100 | #8 | Exceptional 81.6% |
| Sierra Leoneans | 100.0 /100 | #9 | Exceptional 81.5% |
| Immigrants | Sierra Leone | 100.0 /100 | #10 | Exceptional 81.5% |
| Immigrants | Eastern Africa | 100.0 /100 | #11 | Exceptional 81.3% |
| Immigrants | Eritrea | 100.0 /100 | #12 | Exceptional 81.3% |
| Immigrants | India | 100.0 /100 | #13 | Exceptional 81.3% |
| Cambodians | 100.0 /100 | #14 | Exceptional 81.1% |
| Bulgarians | 100.0 /100 | #15 | Exceptional 81.1% |
Demographics Similar to Iraqis by In Labor Force | Age 20-64
In terms of in labor force | age 20-64, the demographic groups most similar to Iraqis are Immigrants from Cambodia (79.3%, a difference of 0.0%), Immigrants from Congo (79.3%, a difference of 0.0%), Nicaraguan (79.3%, a difference of 0.010%), Immigrants from Ecuador (79.3%, a difference of 0.010%), and Immigrants from Oceania (79.3%, a difference of 0.020%).
| Demographics | Rating | Rank | In Labor Force | Age 20-64 |
| Ecuadorians | 23.1 /100 | #196 | Fair 79.4% |
| Immigrants | Senegal | 22.5 /100 | #197 | Fair 79.4% |
| Immigrants | Laos | 21.5 /100 | #198 | Fair 79.4% |
| Dutch | 20.2 /100 | #199 | Fair 79.3% |
| Immigrants | Oceania | 19.1 /100 | #200 | Poor 79.3% |
| Immigrants | Nicaragua | 19.0 /100 | #201 | Poor 79.3% |
| Nicaraguans | 18.3 /100 | #202 | Poor 79.3% |
| Iraqis | 17.7 /100 | #203 | Poor 79.3% |
| Immigrants | Cambodia | 17.6 /100 | #204 | Poor 79.3% |
| Immigrants | Congo | 17.5 /100 | #205 | Poor 79.3% |
| Immigrants | Ecuador | 16.9 /100 | #206 | Poor 79.3% |
| Sub-Saharan Africans | 16.5 /100 | #207 | Poor 79.3% |
| British | 16.5 /100 | #208 | Poor 79.3% |
| Bangladeshis | 16.4 /100 | #209 | Poor 79.3% |
| Haitians | 16.1 /100 | #210 | Poor 79.3% |