Guamanian/Chamorro vs Iraqi In Labor Force | Age 20-64
COMPARE
Guamanian/Chamorro
Iraqi
In Labor Force | Age 20-64
In Labor Force | Age 20-64 Comparison
Guamanians/Chamorros
Iraqis
79.1%
IN LABOR FORCE | AGE 20-64
4.5/ 100
METRIC RATING
232nd/ 347
METRIC RANK
79.3%
IN LABOR FORCE | AGE 20-64
17.7/ 100
METRIC RATING
203rd/ 347
METRIC RANK
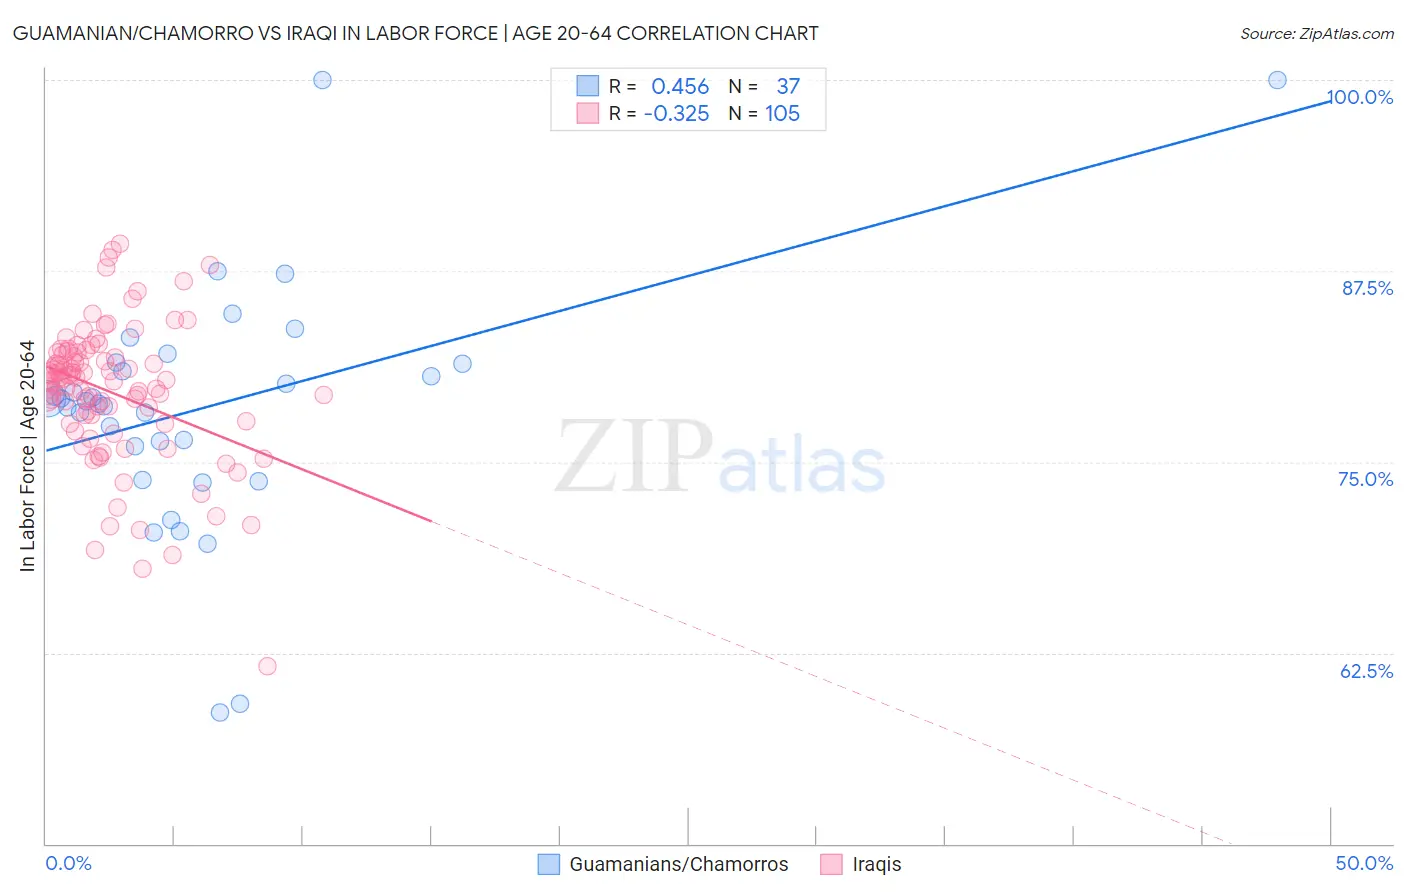
Guamanian/Chamorro vs Iraqi In Labor Force | Age 20-64 Correlation Chart
The statistical analysis conducted on geographies consisting of 221,956,228 people shows a moderate positive correlation between the proportion of Guamanians/Chamorros and labor force participation rate among population between the ages 20 and 64 in the United States with a correlation coefficient (R) of 0.456 and weighted average of 79.1%. Similarly, the statistical analysis conducted on geographies consisting of 170,648,723 people shows a mild negative correlation between the proportion of Iraqis and labor force participation rate among population between the ages 20 and 64 in the United States with a correlation coefficient (R) of -0.325 and weighted average of 79.3%, a difference of 0.30%.
In Labor Force | Age 20-64 Correlation Summary
| Measurement | Guamanian/Chamorro | Iraqi |
| Minimum | 58.6% | 61.6% |
| Maximum | 100.0% | 89.3% |
| Range | 41.4% | 27.7% |
| Mean | 78.6% | 79.6% |
| Median | 79.0% | 80.3% |
| Interquartile 25% (IQ1) | 74.9% | 77.6% |
| Interquartile 75% (IQ3) | 81.4% | 82.1% |
| Interquartile Range (IQR) | 6.5% | 4.5% |
| Standard Deviation (Sample) | 8.1% | 4.6% |
| Standard Deviation (Population) | 7.9% | 4.6% |
Similar Demographics by In Labor Force | Age 20-64
Demographics Similar to Guamanians/Chamorros by In Labor Force | Age 20-64
In terms of in labor force | age 20-64, the demographic groups most similar to Guamanians/Chamorros are Lebanese (79.1%, a difference of 0.020%), Japanese (79.1%, a difference of 0.030%), Panamanian (79.1%, a difference of 0.050%), Alsatian (79.1%, a difference of 0.050%), and Native Hawaiian (79.1%, a difference of 0.050%).
| Demographics | Rating | Rank | In Labor Force | Age 20-64 |
| Portuguese | 6.4 /100 | #225 | Tragic 79.1% |
| Central Americans | 5.9 /100 | #226 | Tragic 79.1% |
| Immigrants | Western Europe | 5.9 /100 | #227 | Tragic 79.1% |
| Panamanians | 5.7 /100 | #228 | Tragic 79.1% |
| Alsatians | 5.7 /100 | #229 | Tragic 79.1% |
| Native Hawaiians | 5.6 /100 | #230 | Tragic 79.1% |
| Lebanese | 5.1 /100 | #231 | Tragic 79.1% |
| Guamanians/Chamorros | 4.5 /100 | #232 | Tragic 79.1% |
| Japanese | 4.0 /100 | #233 | Tragic 79.1% |
| Immigrants | Canada | 3.2 /100 | #234 | Tragic 79.0% |
| Tlingit-Haida | 3.2 /100 | #235 | Tragic 79.0% |
| Samoans | 2.9 /100 | #236 | Tragic 79.0% |
| Immigrants | North America | 2.9 /100 | #237 | Tragic 79.0% |
| Immigrants | Jamaica | 2.6 /100 | #238 | Tragic 79.0% |
| Welsh | 2.4 /100 | #239 | Tragic 79.0% |
Demographics Similar to Iraqis by In Labor Force | Age 20-64
In terms of in labor force | age 20-64, the demographic groups most similar to Iraqis are Immigrants from Cambodia (79.3%, a difference of 0.0%), Immigrants from Congo (79.3%, a difference of 0.0%), Nicaraguan (79.3%, a difference of 0.010%), Immigrants from Ecuador (79.3%, a difference of 0.010%), and Immigrants from Oceania (79.3%, a difference of 0.020%).
| Demographics | Rating | Rank | In Labor Force | Age 20-64 |
| Ecuadorians | 23.1 /100 | #196 | Fair 79.4% |
| Immigrants | Senegal | 22.5 /100 | #197 | Fair 79.4% |
| Immigrants | Laos | 21.5 /100 | #198 | Fair 79.4% |
| Dutch | 20.2 /100 | #199 | Fair 79.3% |
| Immigrants | Oceania | 19.1 /100 | #200 | Poor 79.3% |
| Immigrants | Nicaragua | 19.0 /100 | #201 | Poor 79.3% |
| Nicaraguans | 18.3 /100 | #202 | Poor 79.3% |
| Iraqis | 17.7 /100 | #203 | Poor 79.3% |
| Immigrants | Cambodia | 17.6 /100 | #204 | Poor 79.3% |
| Immigrants | Congo | 17.5 /100 | #205 | Poor 79.3% |
| Immigrants | Ecuador | 16.9 /100 | #206 | Poor 79.3% |
| Sub-Saharan Africans | 16.5 /100 | #207 | Poor 79.3% |
| British | 16.5 /100 | #208 | Poor 79.3% |
| Bangladeshis | 16.4 /100 | #209 | Poor 79.3% |
| Haitians | 16.1 /100 | #210 | Poor 79.3% |