Immigrants from Europe vs Iraqi In Labor Force | Age 20-64
COMPARE
Immigrants from Europe
Iraqi
In Labor Force | Age 20-64
In Labor Force | Age 20-64 Comparison
Immigrants from Europe
Iraqis
79.9%
IN LABOR FORCE | AGE 20-64
91.6/ 100
METRIC RATING
124th/ 347
METRIC RANK
79.3%
IN LABOR FORCE | AGE 20-64
17.7/ 100
METRIC RATING
203rd/ 347
METRIC RANK
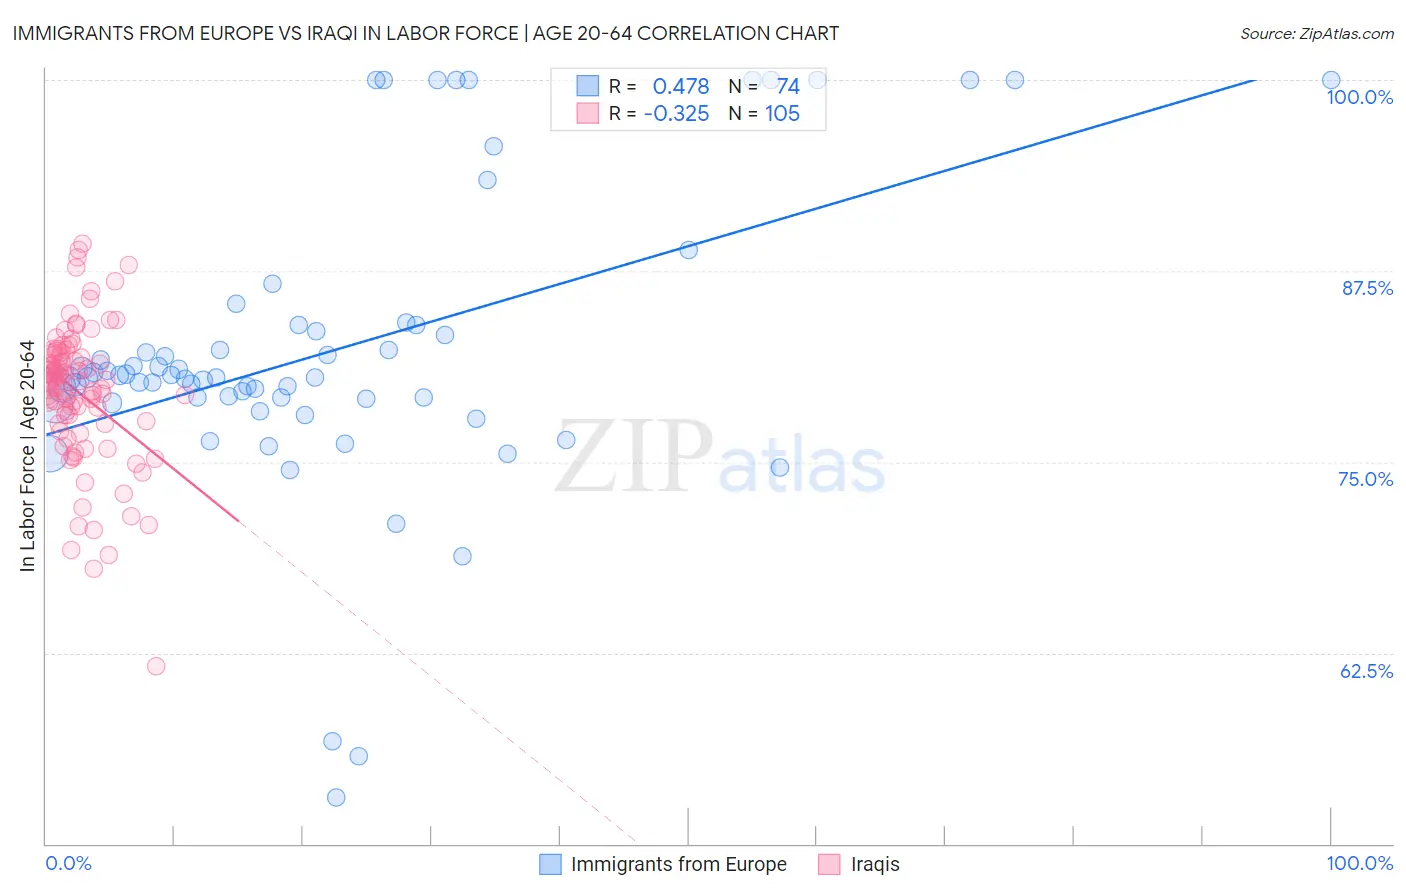
Immigrants from Europe vs Iraqi In Labor Force | Age 20-64 Correlation Chart
The statistical analysis conducted on geographies consisting of 547,427,342 people shows a moderate positive correlation between the proportion of Immigrants from Europe and labor force participation rate among population between the ages 20 and 64 in the United States with a correlation coefficient (R) of 0.478 and weighted average of 79.9%. Similarly, the statistical analysis conducted on geographies consisting of 170,648,723 people shows a mild negative correlation between the proportion of Iraqis and labor force participation rate among population between the ages 20 and 64 in the United States with a correlation coefficient (R) of -0.325 and weighted average of 79.3%, a difference of 0.79%.
In Labor Force | Age 20-64 Correlation Summary
| Measurement | Immigrants from Europe | Iraqi |
| Minimum | 53.0% | 61.6% |
| Maximum | 100.0% | 89.3% |
| Range | 47.0% | 27.7% |
| Mean | 82.3% | 79.6% |
| Median | 80.5% | 80.3% |
| Interquartile 25% (IQ1) | 79.2% | 77.6% |
| Interquartile 75% (IQ3) | 83.9% | 82.1% |
| Interquartile Range (IQR) | 4.8% | 4.5% |
| Standard Deviation (Sample) | 9.7% | 4.6% |
| Standard Deviation (Population) | 9.7% | 4.6% |
Similar Demographics by In Labor Force | Age 20-64
Demographics Similar to Immigrants from Europe by In Labor Force | Age 20-64
In terms of in labor force | age 20-64, the demographic groups most similar to Immigrants from Europe are Immigrants from Russia (79.9%, a difference of 0.0%), Danish (79.9%, a difference of 0.0%), Mongolian (79.9%, a difference of 0.010%), Immigrants from Taiwan (80.0%, a difference of 0.020%), and Maltese (80.0%, a difference of 0.020%).
| Demographics | Rating | Rank | In Labor Force | Age 20-64 |
| Immigrants | Vietnam | 92.7 /100 | #117 | Exceptional 80.0% |
| Cape Verdeans | 92.7 /100 | #118 | Exceptional 80.0% |
| Immigrants | Taiwan | 92.5 /100 | #119 | Exceptional 80.0% |
| Maltese | 92.4 /100 | #120 | Exceptional 80.0% |
| Immigrants | Kuwait | 92.2 /100 | #121 | Exceptional 80.0% |
| Mongolians | 92.0 /100 | #122 | Exceptional 79.9% |
| Immigrants | Russia | 91.8 /100 | #123 | Exceptional 79.9% |
| Immigrants | Europe | 91.6 /100 | #124 | Exceptional 79.9% |
| Danes | 91.5 /100 | #125 | Exceptional 79.9% |
| Immigrants | France | 90.7 /100 | #126 | Exceptional 79.9% |
| Immigrants | Czechoslovakia | 89.7 /100 | #127 | Excellent 79.9% |
| Immigrants | Eastern Asia | 89.4 /100 | #128 | Excellent 79.9% |
| Italians | 88.9 /100 | #129 | Excellent 79.9% |
| Immigrants | Zaire | 88.6 /100 | #130 | Excellent 79.9% |
| Immigrants | Iran | 88.3 /100 | #131 | Excellent 79.9% |
Demographics Similar to Iraqis by In Labor Force | Age 20-64
In terms of in labor force | age 20-64, the demographic groups most similar to Iraqis are Immigrants from Cambodia (79.3%, a difference of 0.0%), Immigrants from Congo (79.3%, a difference of 0.0%), Nicaraguan (79.3%, a difference of 0.010%), Immigrants from Ecuador (79.3%, a difference of 0.010%), and Immigrants from Oceania (79.3%, a difference of 0.020%).
| Demographics | Rating | Rank | In Labor Force | Age 20-64 |
| Ecuadorians | 23.1 /100 | #196 | Fair 79.4% |
| Immigrants | Senegal | 22.5 /100 | #197 | Fair 79.4% |
| Immigrants | Laos | 21.5 /100 | #198 | Fair 79.4% |
| Dutch | 20.2 /100 | #199 | Fair 79.3% |
| Immigrants | Oceania | 19.1 /100 | #200 | Poor 79.3% |
| Immigrants | Nicaragua | 19.0 /100 | #201 | Poor 79.3% |
| Nicaraguans | 18.3 /100 | #202 | Poor 79.3% |
| Iraqis | 17.7 /100 | #203 | Poor 79.3% |
| Immigrants | Cambodia | 17.6 /100 | #204 | Poor 79.3% |
| Immigrants | Congo | 17.5 /100 | #205 | Poor 79.3% |
| Immigrants | Ecuador | 16.9 /100 | #206 | Poor 79.3% |
| Sub-Saharan Africans | 16.5 /100 | #207 | Poor 79.3% |
| British | 16.5 /100 | #208 | Poor 79.3% |
| Bangladeshis | 16.4 /100 | #209 | Poor 79.3% |
| Haitians | 16.1 /100 | #210 | Poor 79.3% |