Immigrants from Indonesia vs Immigrants from Albania In Labor Force | Age 45-54
COMPARE
Immigrants from Indonesia
Immigrants from Albania
In Labor Force | Age 45-54
In Labor Force | Age 45-54 Comparison
Immigrants from Indonesia
Immigrants from Albania
82.9%
IN LABOR FORCE | AGE 45-54
70.6/ 100
METRIC RATING
153rd/ 347
METRIC RANK
83.2%
IN LABOR FORCE | AGE 45-54
91.8/ 100
METRIC RATING
113th/ 347
METRIC RANK
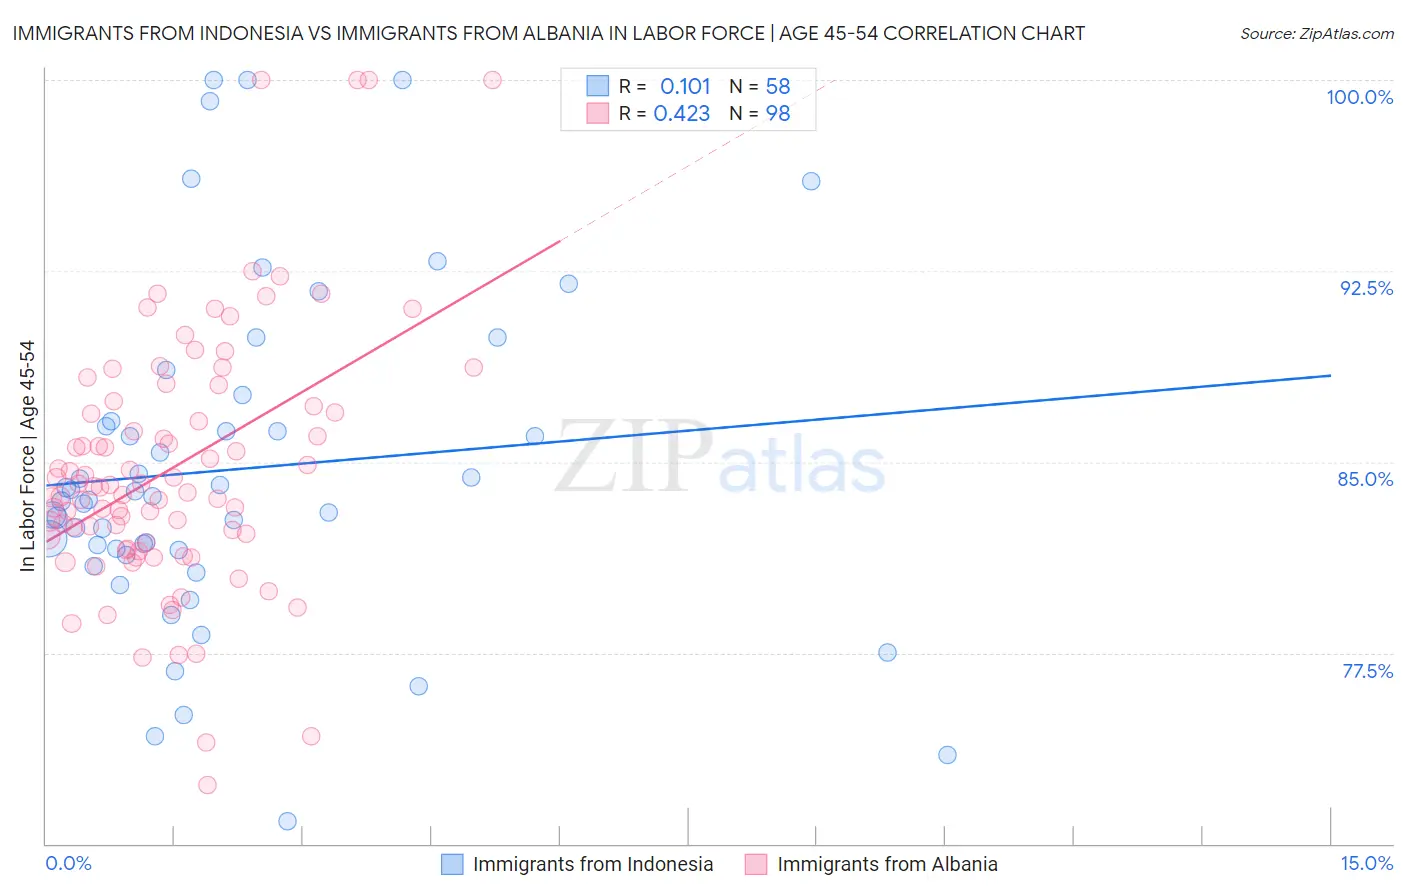
Immigrants from Indonesia vs Immigrants from Albania In Labor Force | Age 45-54 Correlation Chart
The statistical analysis conducted on geographies consisting of 215,716,798 people shows a poor positive correlation between the proportion of Immigrants from Indonesia and labor force participation rate among population between the ages 45 and 54 in the United States with a correlation coefficient (R) of 0.101 and weighted average of 82.9%. Similarly, the statistical analysis conducted on geographies consisting of 119,388,252 people shows a moderate positive correlation between the proportion of Immigrants from Albania and labor force participation rate among population between the ages 45 and 54 in the United States with a correlation coefficient (R) of 0.423 and weighted average of 83.2%, a difference of 0.34%.
In Labor Force | Age 45-54 Correlation Summary
| Measurement | Immigrants from Indonesia | Immigrants from Albania |
| Minimum | 70.9% | 72.3% |
| Maximum | 100.0% | 100.0% |
| Range | 29.1% | 27.7% |
| Mean | 84.7% | 84.8% |
| Median | 83.6% | 84.0% |
| Interquartile 25% (IQ1) | 81.5% | 81.8% |
| Interquartile 75% (IQ3) | 86.6% | 87.2% |
| Interquartile Range (IQR) | 5.1% | 5.4% |
| Standard Deviation (Sample) | 6.6% | 5.1% |
| Standard Deviation (Population) | 6.5% | 5.1% |
Similar Demographics by In Labor Force | Age 45-54
Demographics Similar to Immigrants from Indonesia by In Labor Force | Age 45-54
In terms of in labor force | age 45-54, the demographic groups most similar to Immigrants from Indonesia are Immigrants from Ghana (82.9%, a difference of 0.0%), Korean (82.9%, a difference of 0.010%), Slavic (82.9%, a difference of 0.010%), Immigrants from Netherlands (82.9%, a difference of 0.020%), and Immigrants from Philippines (82.9%, a difference of 0.020%).
| Demographics | Rating | Rank | In Labor Force | Age 45-54 |
| Immigrants | France | 75.3 /100 | #146 | Good 83.0% |
| Czechoslovakians | 74.8 /100 | #147 | Good 83.0% |
| Immigrants | Nigeria | 74.1 /100 | #148 | Good 83.0% |
| Immigrants | Sweden | 73.3 /100 | #149 | Good 82.9% |
| Immigrants | Netherlands | 72.6 /100 | #150 | Good 82.9% |
| Koreans | 71.9 /100 | #151 | Good 82.9% |
| Slavs | 71.5 /100 | #152 | Good 82.9% |
| Immigrants | Indonesia | 70.6 /100 | #153 | Good 82.9% |
| Immigrants | Ghana | 70.3 /100 | #154 | Good 82.9% |
| Immigrants | Philippines | 69.0 /100 | #155 | Good 82.9% |
| Immigrants | Saudi Arabia | 68.8 /100 | #156 | Good 82.9% |
| Immigrants | Australia | 68.2 /100 | #157 | Good 82.9% |
| Immigrants | Southern Europe | 67.8 /100 | #158 | Good 82.9% |
| Immigrants | Austria | 64.6 /100 | #159 | Good 82.9% |
| Laotians | 62.8 /100 | #160 | Good 82.9% |
Demographics Similar to Immigrants from Albania by In Labor Force | Age 45-54
In terms of in labor force | age 45-54, the demographic groups most similar to Immigrants from Albania are Assyrian/Chaldean/Syriac (83.2%, a difference of 0.0%), Immigrants from Chile (83.2%, a difference of 0.010%), Immigrants from Malaysia (83.2%, a difference of 0.010%), Immigrants from Italy (83.2%, a difference of 0.020%), and Immigrants from Afghanistan (83.2%, a difference of 0.020%).
| Demographics | Rating | Rank | In Labor Force | Age 45-54 |
| Sri Lankans | 93.2 /100 | #106 | Exceptional 83.2% |
| Iranians | 92.9 /100 | #107 | Exceptional 83.2% |
| Slovaks | 92.8 /100 | #108 | Exceptional 83.2% |
| Ukrainians | 92.7 /100 | #109 | Exceptional 83.2% |
| Immigrants | Africa | 92.6 /100 | #110 | Exceptional 83.2% |
| Immigrants | Italy | 92.5 /100 | #111 | Exceptional 83.2% |
| Immigrants | Afghanistan | 92.4 /100 | #112 | Exceptional 83.2% |
| Immigrants | Albania | 91.8 /100 | #113 | Exceptional 83.2% |
| Assyrians/Chaldeans/Syriacs | 91.7 /100 | #114 | Exceptional 83.2% |
| Immigrants | Chile | 91.6 /100 | #115 | Exceptional 83.2% |
| Immigrants | Malaysia | 91.4 /100 | #116 | Exceptional 83.2% |
| Immigrants | China | 90.9 /100 | #117 | Exceptional 83.2% |
| Immigrants | Europe | 90.7 /100 | #118 | Exceptional 83.2% |
| Immigrants | Uruguay | 90.2 /100 | #119 | Exceptional 83.2% |
| Immigrants | Russia | 90.1 /100 | #120 | Exceptional 83.2% |