Immigrants from Ethiopia vs Immigrants from Albania In Labor Force | Age 45-54
COMPARE
Immigrants from Ethiopia
Immigrants from Albania
In Labor Force | Age 45-54
In Labor Force | Age 45-54 Comparison
Immigrants from Ethiopia
Immigrants from Albania
84.8%
IN LABOR FORCE | AGE 45-54
100.0/ 100
METRIC RATING
4th/ 347
METRIC RANK
83.2%
IN LABOR FORCE | AGE 45-54
91.8/ 100
METRIC RATING
113th/ 347
METRIC RANK
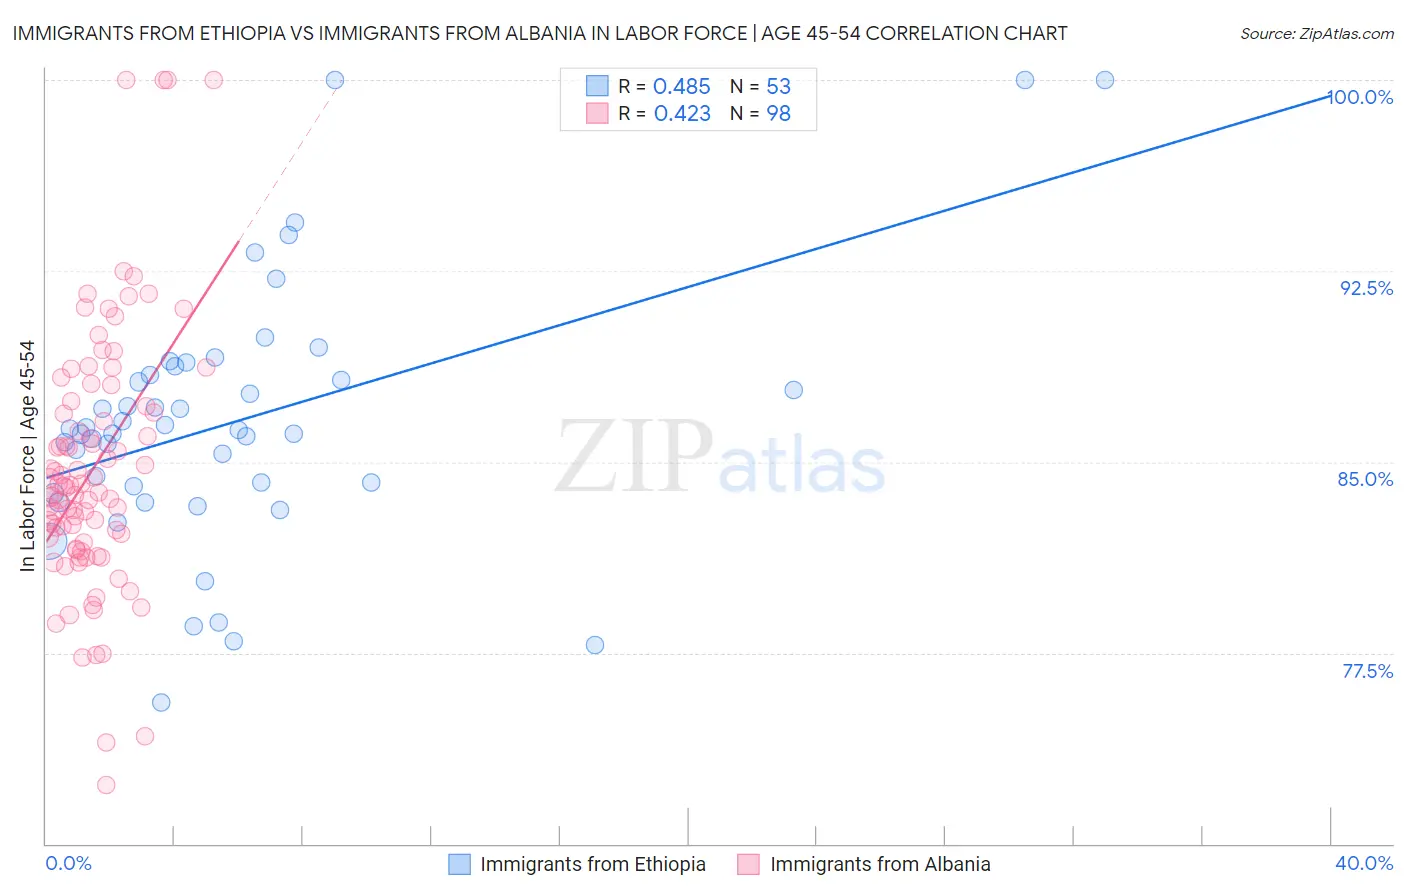
Immigrants from Ethiopia vs Immigrants from Albania In Labor Force | Age 45-54 Correlation Chart
The statistical analysis conducted on geographies consisting of 211,453,316 people shows a moderate positive correlation between the proportion of Immigrants from Ethiopia and labor force participation rate among population between the ages 45 and 54 in the United States with a correlation coefficient (R) of 0.485 and weighted average of 84.8%. Similarly, the statistical analysis conducted on geographies consisting of 119,388,252 people shows a moderate positive correlation between the proportion of Immigrants from Albania and labor force participation rate among population between the ages 45 and 54 in the United States with a correlation coefficient (R) of 0.423 and weighted average of 83.2%, a difference of 1.9%.
In Labor Force | Age 45-54 Correlation Summary
| Measurement | Immigrants from Ethiopia | Immigrants from Albania |
| Minimum | 75.6% | 72.3% |
| Maximum | 100.0% | 100.0% |
| Range | 24.4% | 27.7% |
| Mean | 86.6% | 84.8% |
| Median | 86.2% | 84.0% |
| Interquartile 25% (IQ1) | 83.9% | 81.8% |
| Interquartile 75% (IQ3) | 88.6% | 87.2% |
| Interquartile Range (IQR) | 4.7% | 5.4% |
| Standard Deviation (Sample) | 5.1% | 5.1% |
| Standard Deviation (Population) | 5.0% | 5.1% |
Similar Demographics by In Labor Force | Age 45-54
Demographics Similar to Immigrants from Ethiopia by In Labor Force | Age 45-54
In terms of in labor force | age 45-54, the demographic groups most similar to Immigrants from Ethiopia are Ethiopian (84.8%, a difference of 0.080%), Bolivian (84.9%, a difference of 0.12%), Immigrants from India (84.7%, a difference of 0.19%), Luxembourger (85.0%, a difference of 0.21%), and Immigrants from Cameroon (84.6%, a difference of 0.25%).
| Demographics | Rating | Rank | In Labor Force | Age 45-54 |
| Immigrants | Bolivia | 100.0 /100 | #1 | Exceptional 85.3% |
| Luxembourgers | 100.0 /100 | #2 | Exceptional 85.0% |
| Bolivians | 100.0 /100 | #3 | Exceptional 84.9% |
| Immigrants | Ethiopia | 100.0 /100 | #4 | Exceptional 84.8% |
| Ethiopians | 100.0 /100 | #5 | Exceptional 84.8% |
| Immigrants | India | 100.0 /100 | #6 | Exceptional 84.7% |
| Immigrants | Cameroon | 100.0 /100 | #7 | Exceptional 84.6% |
| Sierra Leoneans | 100.0 /100 | #8 | Exceptional 84.5% |
| Immigrants | Sierra Leone | 100.0 /100 | #9 | Exceptional 84.4% |
| Norwegians | 100.0 /100 | #10 | Exceptional 84.4% |
| Thais | 100.0 /100 | #11 | Exceptional 84.3% |
| Bulgarians | 100.0 /100 | #12 | Exceptional 84.2% |
| Chinese | 99.9 /100 | #13 | Exceptional 84.1% |
| Cambodians | 99.9 /100 | #14 | Exceptional 84.1% |
| Cypriots | 99.9 /100 | #15 | Exceptional 84.1% |
Demographics Similar to Immigrants from Albania by In Labor Force | Age 45-54
In terms of in labor force | age 45-54, the demographic groups most similar to Immigrants from Albania are Assyrian/Chaldean/Syriac (83.2%, a difference of 0.0%), Immigrants from Chile (83.2%, a difference of 0.010%), Immigrants from Malaysia (83.2%, a difference of 0.010%), Immigrants from Italy (83.2%, a difference of 0.020%), and Immigrants from Afghanistan (83.2%, a difference of 0.020%).
| Demographics | Rating | Rank | In Labor Force | Age 45-54 |
| Sri Lankans | 93.2 /100 | #106 | Exceptional 83.2% |
| Iranians | 92.9 /100 | #107 | Exceptional 83.2% |
| Slovaks | 92.8 /100 | #108 | Exceptional 83.2% |
| Ukrainians | 92.7 /100 | #109 | Exceptional 83.2% |
| Immigrants | Africa | 92.6 /100 | #110 | Exceptional 83.2% |
| Immigrants | Italy | 92.5 /100 | #111 | Exceptional 83.2% |
| Immigrants | Afghanistan | 92.4 /100 | #112 | Exceptional 83.2% |
| Immigrants | Albania | 91.8 /100 | #113 | Exceptional 83.2% |
| Assyrians/Chaldeans/Syriacs | 91.7 /100 | #114 | Exceptional 83.2% |
| Immigrants | Chile | 91.6 /100 | #115 | Exceptional 83.2% |
| Immigrants | Malaysia | 91.4 /100 | #116 | Exceptional 83.2% |
| Immigrants | China | 90.9 /100 | #117 | Exceptional 83.2% |
| Immigrants | Europe | 90.7 /100 | #118 | Exceptional 83.2% |
| Immigrants | Uruguay | 90.2 /100 | #119 | Exceptional 83.2% |
| Immigrants | Russia | 90.1 /100 | #120 | Exceptional 83.2% |