Immigrants from Zaire vs Italian In Labor Force | Age 16-19
COMPARE
Immigrants from Zaire
Italian
In Labor Force | Age 16-19
In Labor Force | Age 16-19 Comparison
Immigrants from Zaire
Italians
40.7%
IN LABOR FORCE | AGE 16-19
100.0/ 100
METRIC RATING
51st/ 347
METRIC RANK
40.1%
IN LABOR FORCE | AGE 16-19
99.9/ 100
METRIC RATING
68th/ 347
METRIC RANK
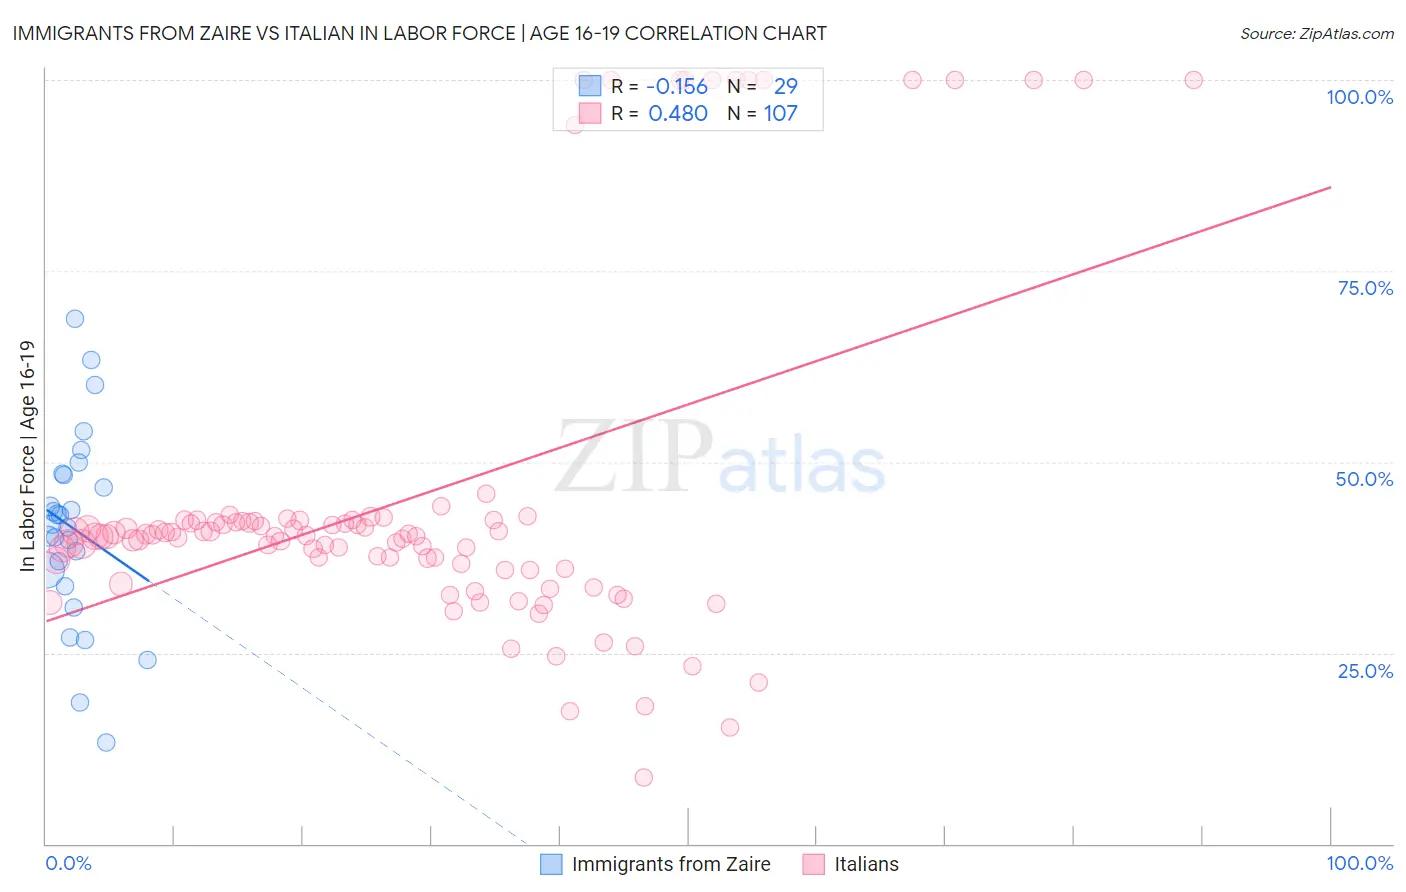
Immigrants from Zaire vs Italian In Labor Force | Age 16-19 Correlation Chart
The statistical analysis conducted on geographies consisting of 107,243,431 people shows a poor negative correlation between the proportion of Immigrants from Zaire and labor force participation rate among population between the ages 16 and 19 in the United States with a correlation coefficient (R) of -0.156 and weighted average of 40.7%. Similarly, the statistical analysis conducted on geographies consisting of 570,596,297 people shows a moderate positive correlation between the proportion of Italians and labor force participation rate among population between the ages 16 and 19 in the United States with a correlation coefficient (R) of 0.480 and weighted average of 40.1%, a difference of 1.5%.
In Labor Force | Age 16-19 Correlation Summary
| Measurement | Immigrants from Zaire | Italian |
| Minimum | 13.3% | 8.6% |
| Maximum | 68.8% | 100.0% |
| Range | 55.5% | 91.4% |
| Mean | 41.3% | 45.2% |
| Median | 41.8% | 40.3% |
| Interquartile 25% (IQ1) | 34.8% | 36.1% |
| Interquartile 75% (IQ3) | 48.3% | 42.3% |
| Interquartile Range (IQR) | 13.6% | 6.2% |
| Standard Deviation (Sample) | 12.4% | 22.2% |
| Standard Deviation (Population) | 12.2% | 22.1% |
Demographics Similar to Immigrants from Zaire and Italians by In Labor Force | Age 16-19
In terms of in labor force | age 16-19, the demographic groups most similar to Immigrants from Zaire are Immigrants from Laos (40.6%, a difference of 0.090%), Indonesian (40.7%, a difference of 0.10%), Cree (40.8%, a difference of 0.26%), Immigrants from Kenya (40.5%, a difference of 0.40%), and Tlingit-Haida (40.5%, a difference of 0.43%). Similarly, the demographic groups most similar to Italians are Canadian (40.1%, a difference of 0.060%), Nonimmigrants (40.1%, a difference of 0.070%), Potawatomi (40.0%, a difference of 0.070%), Kenyan (40.1%, a difference of 0.19%), and Immigrants from Micronesia (40.2%, a difference of 0.27%).
| Demographics | Rating | Rank | In Labor Force | Age 16-19 |
| Cree | 100.0 /100 | #49 | Exceptional 40.8% |
| Indonesians | 100.0 /100 | #50 | Exceptional 40.7% |
| Immigrants | Zaire | 100.0 /100 | #51 | Exceptional 40.7% |
| Immigrants | Laos | 100.0 /100 | #52 | Exceptional 40.6% |
| Immigrants | Kenya | 100.0 /100 | #53 | Exceptional 40.5% |
| Tlingit-Haida | 100.0 /100 | #54 | Exceptional 40.5% |
| British | 100.0 /100 | #55 | Exceptional 40.5% |
| Fijians | 100.0 /100 | #56 | Exceptional 40.4% |
| Lithuanians | 100.0 /100 | #57 | Exceptional 40.4% |
| Aleuts | 100.0 /100 | #58 | Exceptional 40.4% |
| Slavs | 100.0 /100 | #59 | Exceptional 40.4% |
| Immigrants | Eastern Africa | 100.0 /100 | #60 | Exceptional 40.4% |
| Americans | 100.0 /100 | #61 | Exceptional 40.3% |
| Cherokee | 100.0 /100 | #62 | Exceptional 40.2% |
| Northern Europeans | 100.0 /100 | #63 | Exceptional 40.2% |
| Immigrants | Micronesia | 100.0 /100 | #64 | Exceptional 40.2% |
| Kenyans | 100.0 /100 | #65 | Exceptional 40.1% |
| Immigrants | Nonimmigrants | 100.0 /100 | #66 | Exceptional 40.1% |
| Canadians | 100.0 /100 | #67 | Exceptional 40.1% |
| Italians | 99.9 /100 | #68 | Exceptional 40.1% |
| Potawatomi | 99.9 /100 | #69 | Exceptional 40.0% |