Immigrants from Bulgaria vs Sri Lankan In Labor Force | Age 45-54
COMPARE
Immigrants from Bulgaria
Sri Lankan
In Labor Force | Age 45-54
In Labor Force | Age 45-54 Comparison
Immigrants from Bulgaria
Sri Lankans
83.8%
IN LABOR FORCE | AGE 45-54
99.7/ 100
METRIC RATING
30th/ 347
METRIC RANK
83.2%
IN LABOR FORCE | AGE 45-54
93.2/ 100
METRIC RATING
106th/ 347
METRIC RANK
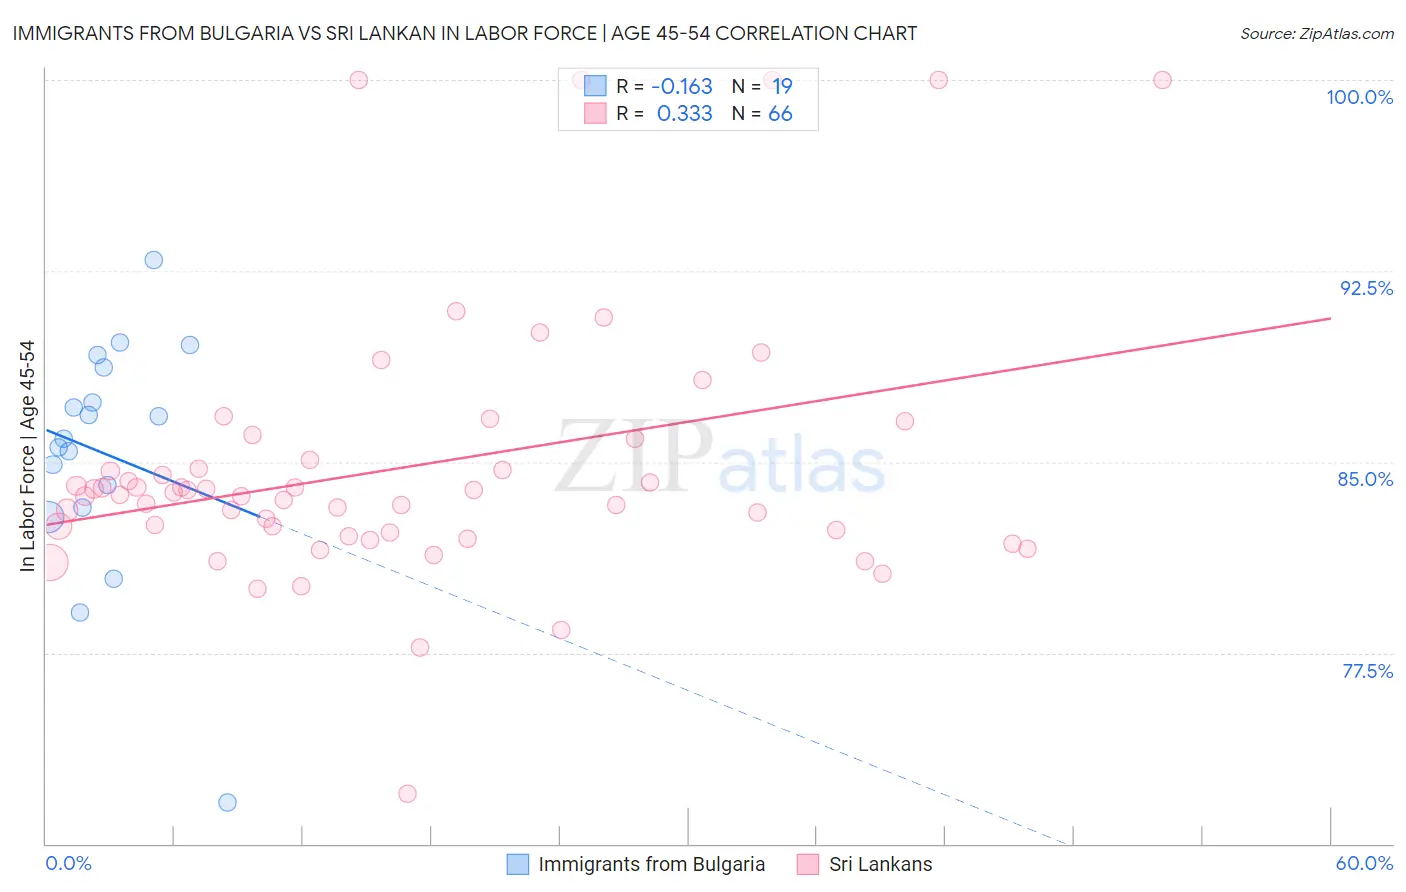
Immigrants from Bulgaria vs Sri Lankan In Labor Force | Age 45-54 Correlation Chart
The statistical analysis conducted on geographies consisting of 172,534,936 people shows a poor negative correlation between the proportion of Immigrants from Bulgaria and labor force participation rate among population between the ages 45 and 54 in the United States with a correlation coefficient (R) of -0.163 and weighted average of 83.8%. Similarly, the statistical analysis conducted on geographies consisting of 440,078,973 people shows a mild positive correlation between the proportion of Sri Lankans and labor force participation rate among population between the ages 45 and 54 in the United States with a correlation coefficient (R) of 0.333 and weighted average of 83.2%, a difference of 0.71%.
In Labor Force | Age 45-54 Correlation Summary
| Measurement | Immigrants from Bulgaria | Sri Lankan |
| Minimum | 71.6% | 72.0% |
| Maximum | 92.9% | 100.0% |
| Range | 21.3% | 28.0% |
| Mean | 85.3% | 84.8% |
| Median | 85.9% | 83.7% |
| Interquartile 25% (IQ1) | 83.2% | 82.2% |
| Interquartile 75% (IQ3) | 88.7% | 85.1% |
| Interquartile Range (IQR) | 5.5% | 2.8% |
| Standard Deviation (Sample) | 4.7% | 5.3% |
| Standard Deviation (Population) | 4.6% | 5.2% |
Similar Demographics by In Labor Force | Age 45-54
Demographics Similar to Immigrants from Bulgaria by In Labor Force | Age 45-54
In terms of in labor force | age 45-54, the demographic groups most similar to Immigrants from Bulgaria are Immigrants from Eritrea (83.8%, a difference of 0.020%), Immigrants from Pakistan (83.8%, a difference of 0.030%), Immigrants from Lithuania (83.9%, a difference of 0.040%), Turkish (83.8%, a difference of 0.040%), and Latvian (83.8%, a difference of 0.040%).
| Demographics | Rating | Rank | In Labor Force | Age 45-54 |
| Tlingit-Haida | 99.8 /100 | #23 | Exceptional 83.9% |
| Slovenes | 99.8 /100 | #24 | Exceptional 83.9% |
| Immigrants | North Macedonia | 99.8 /100 | #25 | Exceptional 83.9% |
| Immigrants | Serbia | 99.8 /100 | #26 | Exceptional 83.9% |
| Immigrants | Brazil | 99.8 /100 | #27 | Exceptional 83.9% |
| Immigrants | Lithuania | 99.8 /100 | #28 | Exceptional 83.9% |
| Immigrants | Pakistan | 99.7 /100 | #29 | Exceptional 83.8% |
| Immigrants | Bulgaria | 99.7 /100 | #30 | Exceptional 83.8% |
| Immigrants | Eritrea | 99.7 /100 | #31 | Exceptional 83.8% |
| Turks | 99.7 /100 | #32 | Exceptional 83.8% |
| Latvians | 99.7 /100 | #33 | Exceptional 83.8% |
| Kenyans | 99.5 /100 | #34 | Exceptional 83.7% |
| Brazilians | 99.5 /100 | #35 | Exceptional 83.7% |
| Ugandans | 99.5 /100 | #36 | Exceptional 83.7% |
| Swedes | 99.4 /100 | #37 | Exceptional 83.7% |
Demographics Similar to Sri Lankans by In Labor Force | Age 45-54
In terms of in labor force | age 45-54, the demographic groups most similar to Sri Lankans are Immigrants from South America (83.2%, a difference of 0.010%), Iranian (83.2%, a difference of 0.010%), Slovak (83.2%, a difference of 0.010%), Immigrants from Romania (83.3%, a difference of 0.020%), and Ukrainian (83.2%, a difference of 0.020%).
| Demographics | Rating | Rank | In Labor Force | Age 45-54 |
| Immigrants | Middle Africa | 94.3 /100 | #99 | Exceptional 83.3% |
| Mongolians | 94.2 /100 | #100 | Exceptional 83.3% |
| Immigrants | Belarus | 94.1 /100 | #101 | Exceptional 83.3% |
| Immigrants | Singapore | 93.9 /100 | #102 | Exceptional 83.3% |
| Albanians | 93.9 /100 | #103 | Exceptional 83.3% |
| Immigrants | Romania | 93.8 /100 | #104 | Exceptional 83.3% |
| Immigrants | South America | 93.5 /100 | #105 | Exceptional 83.2% |
| Sri Lankans | 93.2 /100 | #106 | Exceptional 83.2% |
| Iranians | 92.9 /100 | #107 | Exceptional 83.2% |
| Slovaks | 92.8 /100 | #108 | Exceptional 83.2% |
| Ukrainians | 92.7 /100 | #109 | Exceptional 83.2% |
| Immigrants | Africa | 92.6 /100 | #110 | Exceptional 83.2% |
| Immigrants | Italy | 92.5 /100 | #111 | Exceptional 83.2% |
| Immigrants | Afghanistan | 92.4 /100 | #112 | Exceptional 83.2% |
| Immigrants | Albania | 91.8 /100 | #113 | Exceptional 83.2% |