Immigrants from Bolivia vs Immigrants from Laos In Labor Force | Age 20-24
COMPARE
Immigrants from Bolivia
Immigrants from Laos
In Labor Force | Age 20-24
In Labor Force | Age 20-24 Comparison
Immigrants from Bolivia
Immigrants from Laos
75.3%
IN LABOR FORCE | AGE 20-24
71.0/ 100
METRIC RATING
158th/ 347
METRIC RANK
77.4%
IN LABOR FORCE | AGE 20-24
100.0/ 100
METRIC RATING
43rd/ 347
METRIC RANK
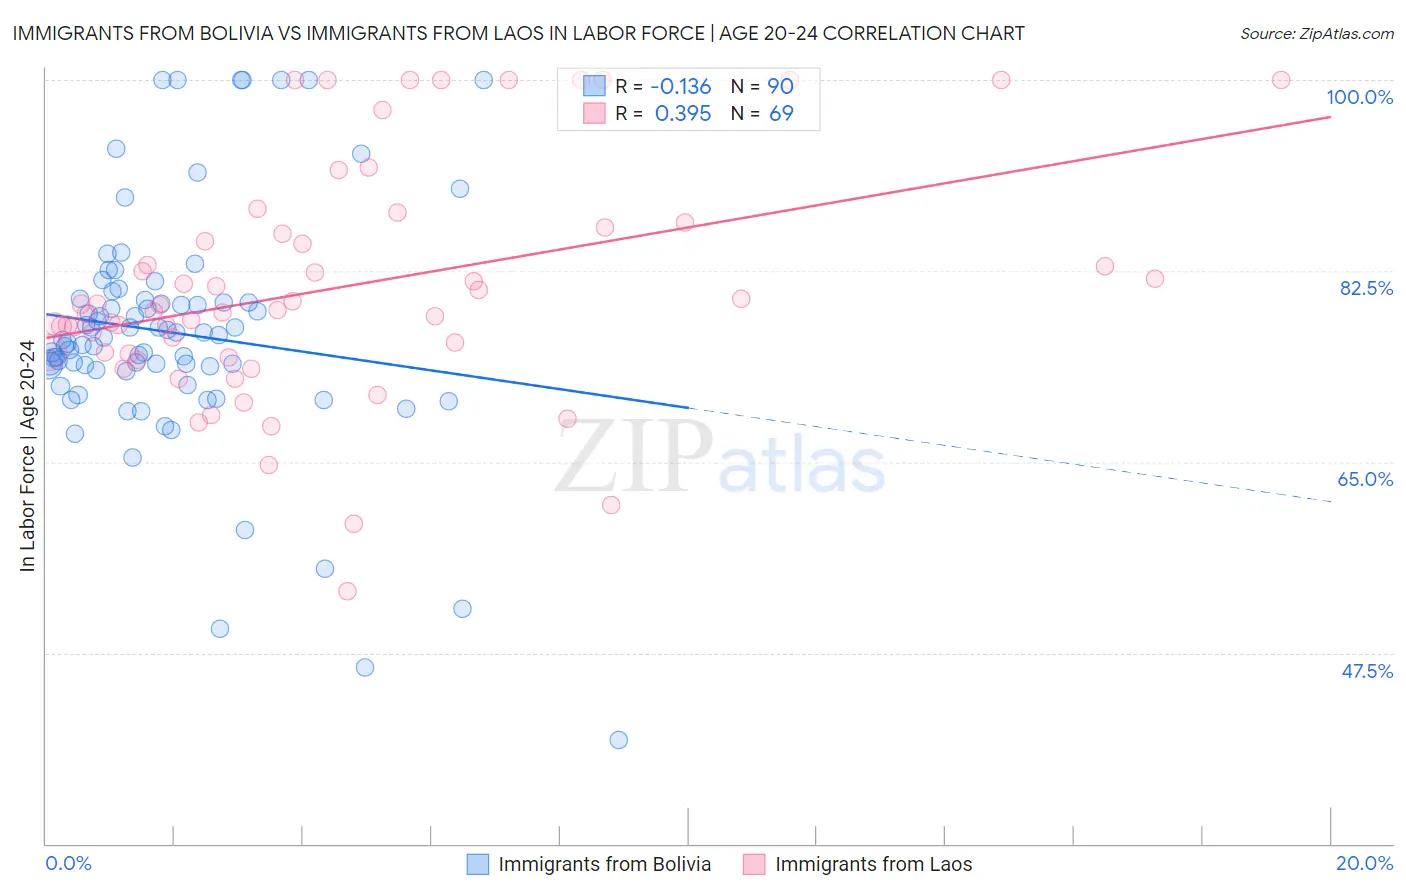
Immigrants from Bolivia vs Immigrants from Laos In Labor Force | Age 20-24 Correlation Chart
The statistical analysis conducted on geographies consisting of 158,683,867 people shows a poor negative correlation between the proportion of Immigrants from Bolivia and labor force participation rate among population between the ages 20 and 24 in the United States with a correlation coefficient (R) of -0.136 and weighted average of 75.3%. Similarly, the statistical analysis conducted on geographies consisting of 201,409,427 people shows a mild positive correlation between the proportion of Immigrants from Laos and labor force participation rate among population between the ages 20 and 24 in the United States with a correlation coefficient (R) of 0.395 and weighted average of 77.4%, a difference of 2.8%.
In Labor Force | Age 20-24 Correlation Summary
| Measurement | Immigrants from Bolivia | Immigrants from Laos |
| Minimum | 39.5% | 53.1% |
| Maximum | 100.0% | 100.0% |
| Range | 60.5% | 46.9% |
| Mean | 76.8% | 81.0% |
| Median | 76.3% | 78.9% |
| Interquartile 25% (IQ1) | 73.4% | 75.0% |
| Interquartile 75% (IQ3) | 79.8% | 86.2% |
| Interquartile Range (IQR) | 6.5% | 11.2% |
| Standard Deviation (Sample) | 10.9% | 10.6% |
| Standard Deviation (Population) | 10.9% | 10.6% |
Similar Demographics by In Labor Force | Age 20-24
Demographics Similar to Immigrants from Bolivia by In Labor Force | Age 20-24
In terms of in labor force | age 20-24, the demographic groups most similar to Immigrants from Bolivia are Immigrants from El Salvador (75.3%, a difference of 0.010%), Immigrants from Western Europe (75.3%, a difference of 0.010%), Guatemalan (75.3%, a difference of 0.020%), Osage (75.3%, a difference of 0.020%), and Immigrants from Guatemala (75.3%, a difference of 0.020%).
| Demographics | Rating | Rank | In Labor Force | Age 20-24 |
| Paiute | 74.1 /100 | #151 | Good 75.3% |
| Lebanese | 73.5 /100 | #152 | Good 75.3% |
| Guatemalans | 72.3 /100 | #153 | Good 75.3% |
| Osage | 72.3 /100 | #154 | Good 75.3% |
| Immigrants | Guatemala | 71.9 /100 | #155 | Good 75.3% |
| Immigrants | El Salvador | 71.7 /100 | #156 | Good 75.3% |
| Immigrants | Western Europe | 71.5 /100 | #157 | Good 75.3% |
| Immigrants | Bolivia | 71.0 /100 | #158 | Good 75.3% |
| South American Indians | 69.0 /100 | #159 | Good 75.3% |
| Japanese | 68.7 /100 | #160 | Good 75.3% |
| New Zealanders | 65.4 /100 | #161 | Good 75.2% |
| Immigrants | Romania | 64.6 /100 | #162 | Good 75.2% |
| Costa Ricans | 64.2 /100 | #163 | Good 75.2% |
| Bolivians | 64.0 /100 | #164 | Good 75.2% |
| Afghans | 63.5 /100 | #165 | Good 75.2% |
Demographics Similar to Immigrants from Laos by In Labor Force | Age 20-24
In terms of in labor force | age 20-24, the demographic groups most similar to Immigrants from Laos are French (77.4%, a difference of 0.0%), Fijian (77.4%, a difference of 0.010%), Immigrants from Congo (77.4%, a difference of 0.020%), Native Hawaiian (77.4%, a difference of 0.020%), and Scottish (77.4%, a difference of 0.030%).
| Demographics | Rating | Rank | In Labor Force | Age 20-24 |
| Welsh | 100.0 /100 | #36 | Exceptional 77.5% |
| Czechoslovakians | 100.0 /100 | #37 | Exceptional 77.5% |
| Marshallese | 100.0 /100 | #38 | Exceptional 77.4% |
| Irish | 100.0 /100 | #39 | Exceptional 77.4% |
| Scottish | 100.0 /100 | #40 | Exceptional 77.4% |
| Immigrants | Congo | 100.0 /100 | #41 | Exceptional 77.4% |
| French | 100.0 /100 | #42 | Exceptional 77.4% |
| Immigrants | Laos | 100.0 /100 | #43 | Exceptional 77.4% |
| Fijians | 100.0 /100 | #44 | Exceptional 77.4% |
| Native Hawaiians | 100.0 /100 | #45 | Exceptional 77.4% |
| Samoans | 100.0 /100 | #46 | Exceptional 77.4% |
| Ethiopians | 100.0 /100 | #47 | Exceptional 77.3% |
| Serbians | 100.0 /100 | #48 | Exceptional 77.3% |
| Chinese | 100.0 /100 | #49 | Exceptional 77.3% |
| Malaysians | 100.0 /100 | #50 | Exceptional 77.2% |