Dutch vs Immigrants from Armenia In Labor Force | Age 30-34
COMPARE
Dutch
Immigrants from Armenia
In Labor Force | Age 30-34
In Labor Force | Age 30-34 Comparison
Dutch
Immigrants from Armenia
84.5%
IN LABOR FORCE | AGE 30-34
20.2/ 100
METRIC RATING
198th/ 347
METRIC RANK
84.8%
IN LABOR FORCE | AGE 30-34
64.7/ 100
METRIC RATING
158th/ 347
METRIC RANK
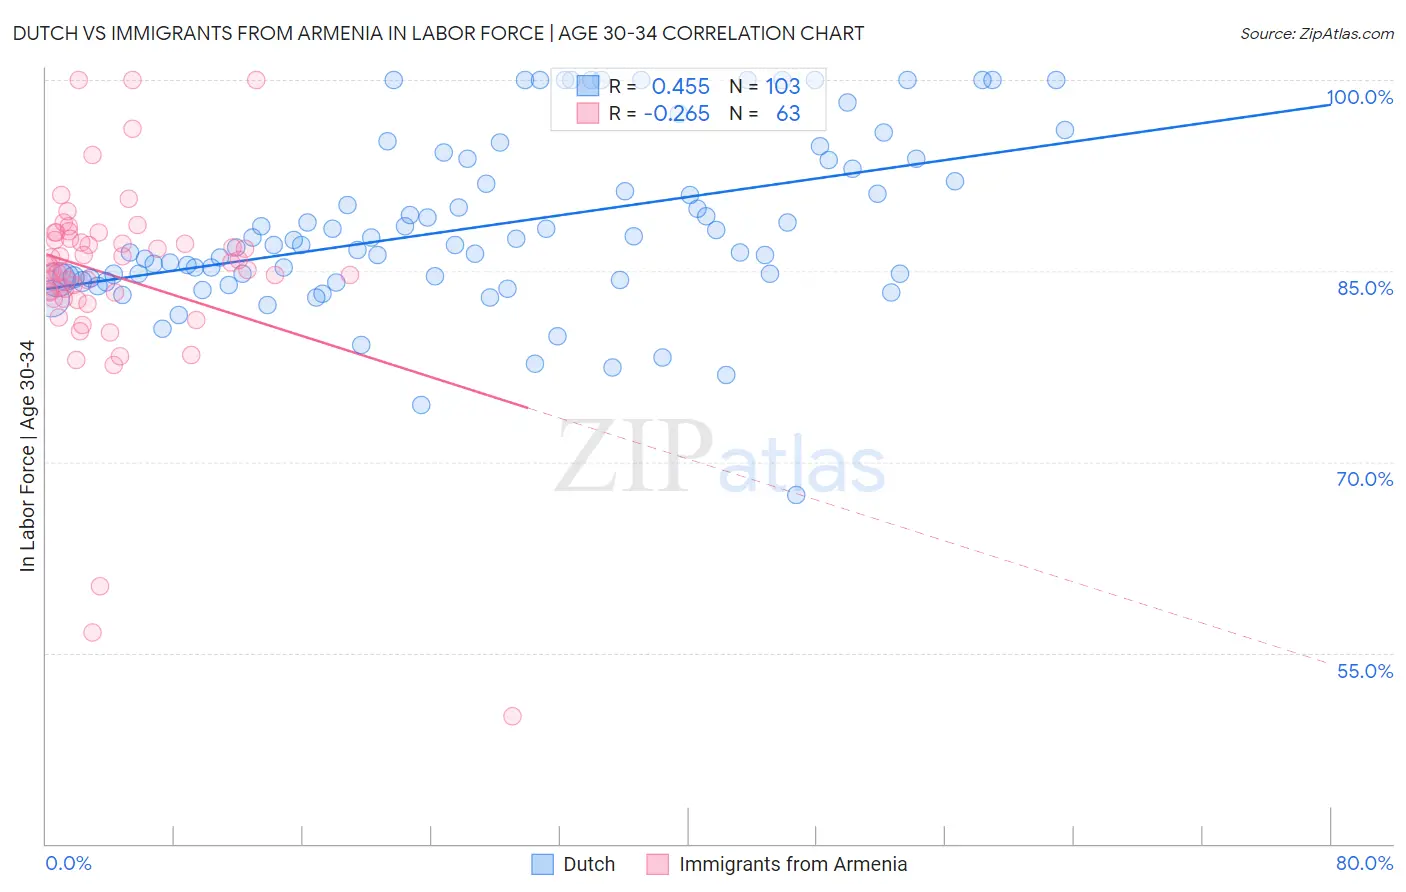
Dutch vs Immigrants from Armenia In Labor Force | Age 30-34 Correlation Chart
The statistical analysis conducted on geographies consisting of 553,365,040 people shows a moderate positive correlation between the proportion of Dutch and labor force participation rate among population between the ages 30 and 34 in the United States with a correlation coefficient (R) of 0.455 and weighted average of 84.5%. Similarly, the statistical analysis conducted on geographies consisting of 97,710,300 people shows a weak negative correlation between the proportion of Immigrants from Armenia and labor force participation rate among population between the ages 30 and 34 in the United States with a correlation coefficient (R) of -0.265 and weighted average of 84.8%, a difference of 0.35%.
In Labor Force | Age 30-34 Correlation Summary
| Measurement | Dutch | Immigrants from Armenia |
| Minimum | 67.4% | 50.0% |
| Maximum | 100.0% | 100.0% |
| Range | 32.6% | 50.0% |
| Mean | 88.5% | 84.6% |
| Median | 87.0% | 85.2% |
| Interquartile 25% (IQ1) | 84.3% | 82.9% |
| Interquartile 75% (IQ3) | 93.7% | 87.5% |
| Interquartile Range (IQR) | 9.4% | 4.6% |
| Standard Deviation (Sample) | 6.7% | 8.1% |
| Standard Deviation (Population) | 6.7% | 8.0% |
Similar Demographics by In Labor Force | Age 30-34
Demographics Similar to Dutch by In Labor Force | Age 30-34
In terms of in labor force | age 30-34, the demographic groups most similar to Dutch are Immigrants from Thailand (84.5%, a difference of 0.010%), Subsaharan African (84.5%, a difference of 0.010%), Immigrants from Syria (84.5%, a difference of 0.020%), Trinidadian and Tobagonian (84.5%, a difference of 0.020%), and Immigrants from West Indies (84.5%, a difference of 0.020%).
| Demographics | Rating | Rank | In Labor Force | Age 30-34 |
| Hungarians | 24.8 /100 | #191 | Fair 84.5% |
| Scandinavians | 24.7 /100 | #192 | Fair 84.5% |
| Immigrants | Costa Rica | 23.9 /100 | #193 | Fair 84.5% |
| Immigrants | Afghanistan | 23.5 /100 | #194 | Fair 84.5% |
| Koreans | 23.2 /100 | #195 | Fair 84.5% |
| British | 22.9 /100 | #196 | Fair 84.5% |
| Immigrants | Syria | 21.9 /100 | #197 | Fair 84.5% |
| Dutch | 20.2 /100 | #198 | Fair 84.5% |
| Immigrants | Thailand | 19.1 /100 | #199 | Poor 84.5% |
| Sub-Saharan Africans | 19.0 /100 | #200 | Poor 84.5% |
| Trinidadians and Tobagonians | 18.2 /100 | #201 | Poor 84.5% |
| Immigrants | West Indies | 18.1 /100 | #202 | Poor 84.5% |
| Canadians | 15.4 /100 | #203 | Poor 84.4% |
| Ecuadorians | 14.2 /100 | #204 | Poor 84.4% |
| French | 13.8 /100 | #205 | Poor 84.4% |
Demographics Similar to Immigrants from Armenia by In Labor Force | Age 30-34
In terms of in labor force | age 30-34, the demographic groups most similar to Immigrants from Armenia are Peruvian (84.8%, a difference of 0.010%), Czechoslovakian (84.8%, a difference of 0.010%), French Canadian (84.8%, a difference of 0.020%), Pakistani (84.7%, a difference of 0.030%), and Immigrants from Cambodia (84.7%, a difference of 0.030%).
| Demographics | Rating | Rank | In Labor Force | Age 30-34 |
| Immigrants | Senegal | 74.0 /100 | #151 | Good 84.8% |
| Romanians | 73.5 /100 | #152 | Good 84.8% |
| Syrians | 70.1 /100 | #153 | Good 84.8% |
| Northern Europeans | 70.0 /100 | #154 | Good 84.8% |
| Immigrants | Sudan | 69.5 /100 | #155 | Good 84.8% |
| French Canadians | 67.3 /100 | #156 | Good 84.8% |
| Peruvians | 65.9 /100 | #157 | Good 84.8% |
| Immigrants | Armenia | 64.7 /100 | #158 | Good 84.8% |
| Czechoslovakians | 63.0 /100 | #159 | Good 84.8% |
| Pakistanis | 60.8 /100 | #160 | Good 84.7% |
| Immigrants | Cambodia | 60.7 /100 | #161 | Good 84.7% |
| South Americans | 58.7 /100 | #162 | Average 84.7% |
| Immigrants | Uruguay | 57.4 /100 | #163 | Average 84.7% |
| Icelanders | 56.8 /100 | #164 | Average 84.7% |
| Immigrants | Western Europe | 56.7 /100 | #165 | Average 84.7% |