Immigrants from Belarus vs Immigrants from Russia In Labor Force | Age 25-29
COMPARE
Immigrants from Belarus
Immigrants from Russia
In Labor Force | Age 25-29
In Labor Force | Age 25-29 Comparison
Immigrants from Belarus
Immigrants from Russia
85.0%
IN LABOR FORCE | AGE 25-29
88.0/ 100
METRIC RATING
117th/ 347
METRIC RANK
84.9%
IN LABOR FORCE | AGE 25-29
81.6/ 100
METRIC RATING
129th/ 347
METRIC RANK
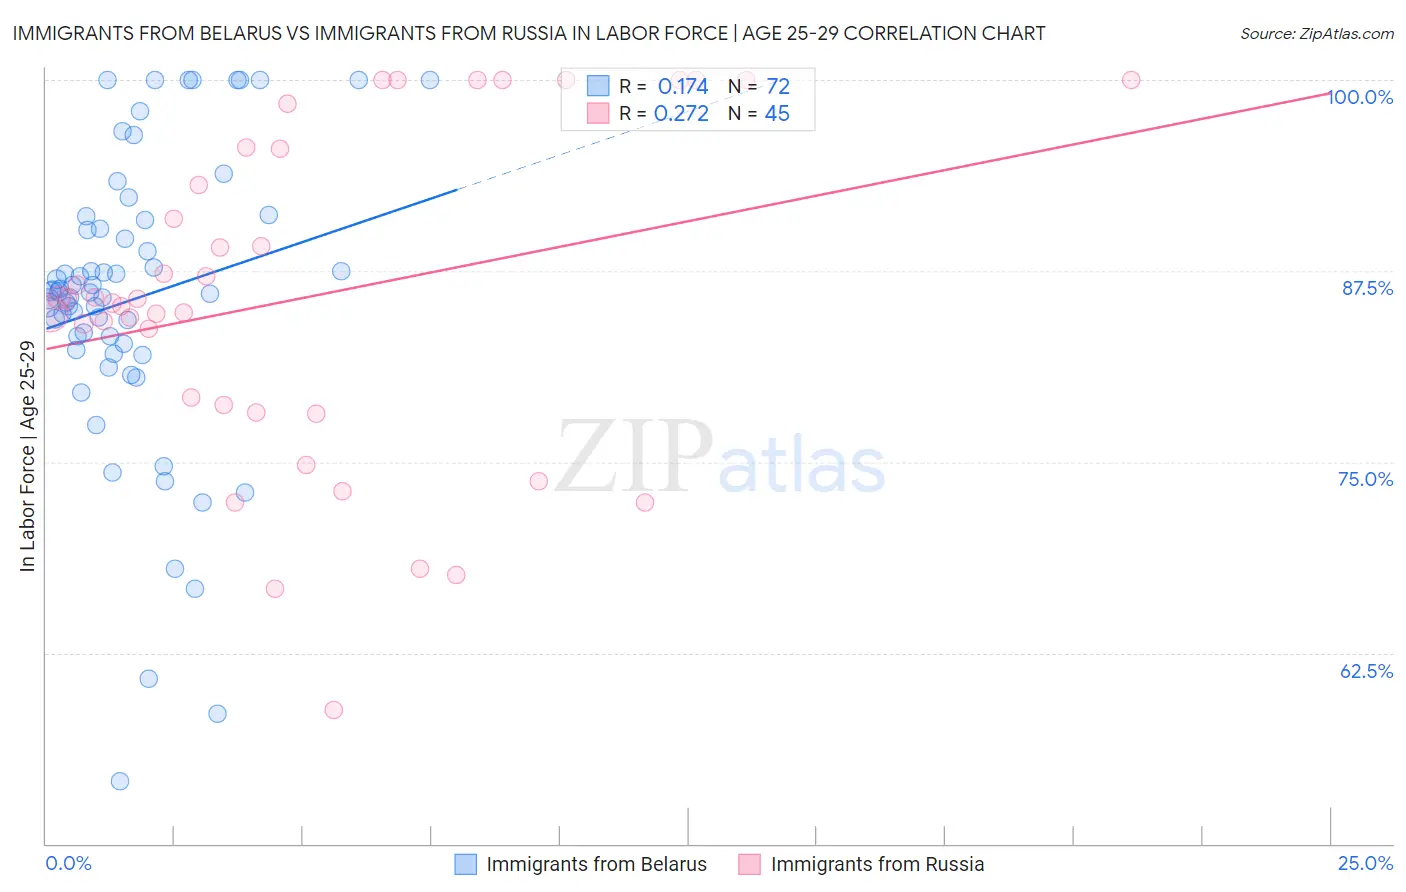
Immigrants from Belarus vs Immigrants from Russia In Labor Force | Age 25-29 Correlation Chart
The statistical analysis conducted on geographies consisting of 150,199,937 people shows a poor positive correlation between the proportion of Immigrants from Belarus and labor force participation rate among population between the ages 25 and 29 in the United States with a correlation coefficient (R) of 0.174 and weighted average of 85.0%. Similarly, the statistical analysis conducted on geographies consisting of 347,809,733 people shows a weak positive correlation between the proportion of Immigrants from Russia and labor force participation rate among population between the ages 25 and 29 in the United States with a correlation coefficient (R) of 0.272 and weighted average of 84.9%, a difference of 0.090%.
In Labor Force | Age 25-29 Correlation Summary
| Measurement | Immigrants from Belarus | Immigrants from Russia |
| Minimum | 54.1% | 58.8% |
| Maximum | 100.0% | 100.0% |
| Range | 45.9% | 41.2% |
| Mean | 85.7% | 85.7% |
| Median | 86.1% | 85.7% |
| Interquartile 25% (IQ1) | 82.5% | 78.5% |
| Interquartile 75% (IQ3) | 90.5% | 95.5% |
| Interquartile Range (IQR) | 8.0% | 17.1% |
| Standard Deviation (Sample) | 9.6% | 10.7% |
| Standard Deviation (Population) | 9.6% | 10.6% |
Demographics Similar to Immigrants from Belarus and Immigrants from Russia by In Labor Force | Age 25-29
In terms of in labor force | age 25-29, the demographic groups most similar to Immigrants from Belarus are Finnish (85.0%, a difference of 0.0%), Filipino (84.9%, a difference of 0.010%), South African (85.0%, a difference of 0.020%), Chilean (85.0%, a difference of 0.020%), and Immigrants from South Africa (84.9%, a difference of 0.030%). Similarly, the demographic groups most similar to Immigrants from Russia are Northern European (84.9%, a difference of 0.0%), Immigrants from Uruguay (84.9%, a difference of 0.030%), Australian (84.9%, a difference of 0.030%), Dutch (84.9%, a difference of 0.040%), and Immigrants from Iran (84.9%, a difference of 0.040%).
| Demographics | Rating | Rank | In Labor Force | Age 25-29 |
| Irish | 90.6 /100 | #113 | Exceptional 85.0% |
| Immigrants | Malaysia | 90.4 /100 | #114 | Exceptional 85.0% |
| South Africans | 88.9 /100 | #115 | Excellent 85.0% |
| Chileans | 88.8 /100 | #116 | Excellent 85.0% |
| Immigrants | Belarus | 88.0 /100 | #117 | Excellent 85.0% |
| Finns | 87.8 /100 | #118 | Excellent 85.0% |
| Filipinos | 87.1 /100 | #119 | Excellent 84.9% |
| Immigrants | South Africa | 86.1 /100 | #120 | Excellent 84.9% |
| Immigrants | Chile | 85.6 /100 | #121 | Excellent 84.9% |
| Scandinavians | 85.1 /100 | #122 | Excellent 84.9% |
| Dutch | 84.9 /100 | #123 | Excellent 84.9% |
| Immigrants | Iran | 84.8 /100 | #124 | Excellent 84.9% |
| Uruguayans | 84.7 /100 | #125 | Excellent 84.9% |
| Immigrants | Singapore | 84.4 /100 | #126 | Excellent 84.9% |
| Immigrants | Uruguay | 84.0 /100 | #127 | Excellent 84.9% |
| Australians | 83.6 /100 | #128 | Excellent 84.9% |
| Immigrants | Russia | 81.6 /100 | #129 | Excellent 84.9% |
| Northern Europeans | 81.3 /100 | #130 | Excellent 84.9% |
| Iranians | 78.1 /100 | #131 | Good 84.8% |
| Romanians | 77.7 /100 | #132 | Good 84.8% |
| Asians | 77.7 /100 | #133 | Good 84.8% |