Immigrants from Bangladesh vs Immigrants from Austria In Labor Force | Age 25-29

COMPARE

Immigrants from Bangladesh
Race
Ancestry
AfghanAfricanAlaska NativeAlaskan AthabascanAlbanianAleutAlsatianAmericanApacheArabArapahoArgentineanArmenianAssyrian/Chaldean/SyriacAustralianAustrianBahamianBangladeshiBarbadianBasqueBelgianBelizeanBermudanBhutaneseBlackfeetBolivianBrazilianBritishBritish West IndianBulgarianBurmeseCajunCambodianCanadianCape VerdeanCarpatho RusynCelticCentral AmericanCentral American IndianCherokeeCheyenneChickasawChileanChineseChippewaChoctawColombianColvilleComancheCosta RicanCreeCreekCroatianCrowCubanCypriotCzechCzechoslovakianDanishDelawareDominicanDutchDutch West IndianEastern EuropeanEcuadorianEgyptianEnglishEstonianEthiopianEuropeanFijianFilipinoFinnishFrenchFrench American IndianFrench CanadianGermanGerman RussianGhanaianGreekGuamanian/ChamorroGuatemalanGuyaneseHaitianHmongHonduranHopiHoumaHungarianIcelanderIndian (Asian)IndonesianInupiatIranianIraqiIrishIroquoisIsraeliItalianJamaicanJapaneseJordanianKenyanKiowaKoreanLaotianLatvianLebaneseLiberianLithuanianLumbeeLuxembourgerMacedonianMalaysianMalteseMarshalleseMenomineeMexicanMexican American IndianMongolianMoroccanNative HawaiianNavajoNepaleseNew ZealanderNicaraguanNigerianNorthern EuropeanNorwegianOkinawanOsageOttawaPaiutePakistaniPalestinianPanamanianParaguayanPennsylvania GermanPeruvianPimaPolishPortuguesePotawatomiPuebloPuerto RicanPuget Sound SalishRomanianRussianSalvadoranSamoanScandinavianScotch-IrishScottishSeminoleSenegaleseSerbianShoshoneSierra LeoneanSiouxSlavicSlovakSloveneSomaliSouth AfricanSouth AmericanSouth American IndianSoviet UnionSpaniardSpanishSpanish AmericanSpanish American IndianSri LankanSubsaharan AfricanSudaneseSwedishSwissSyrianTaiwaneseThaiTlingit-HaidaTohono O'OdhamTonganTrinidadian and TobagonianTsimshianTurkishU.S. Virgin IslanderUgandanUkrainianUruguayanUteVenezuelanVietnameseWelshWest IndianYakamaYaquiYugoslavianYumanYup'ikZimbabwean
Immigration
NonimmigrantsImmigrantsAfghanistanAfricaAlbaniaArgentinaArmeniaAsiaAustraliaBahamasBangladeshBarbadosBelarusBelgiumBelizeBoliviaBosnia and HerzegovinaBrazilBulgariaBurma/MyanmarCabo VerdeCambodiaCameroonCanadaCaribbeanCentral AmericaChileChinaColombiaCongoCosta RicaCroatiaCubaCzechoslovakiaDenmarkDominicaDominican RepublicEastern AfricaEastern AsiaEastern EuropeEcuadorEgyptEl SalvadorEnglandEritreaEthiopiaEuropeFijiFranceGermanyGhanaGreeceGrenadaGuatemalaGuyanaHaitiHondurasHong KongHungaryIndiaIndonesiaIranIraqIrelandIsraelItalyJamaicaJapanJordanKazakhstanKenyaKoreaKuwaitLaosLatin AmericaLatviaLebanonLiberiaLithuaniaMalaysiaMexicoMicronesiaMiddle AfricaMoldovaMoroccoNepalNetherlandsNicaraguaNigeriaNorth AmericaNorth MacedoniaNorthern AfricaNorthern EuropeNorwayOceaniaPakistanPanamaPeruPhilippinesPolandPortugalRomaniaRussiaSaudi ArabiaScotlandSenegalSerbiaSierra LeoneSingaporeSomaliaSouth AfricaSouth AmericaSouth Central AsiaSouth Eastern AsiaSouthern EuropeSpainSri LankaSt. Vincent and the GrenadinesSudanSwedenSwitzerlandSyriaTaiwanThailandTrinidad and TobagoTurkeyUgandaUkraineUruguayUzbekistanVenezuelaVietnamWest IndiesWestern AfricaWestern AsiaWestern EuropeYemenZaireZimbabweAzores
Immigrants from Austria
Race
Ancestry
AfghanAfricanAlaska NativeAlaskan AthabascanAlbanianAleutAlsatianAmericanApacheArabArapahoArgentineanArmenianAssyrian/Chaldean/SyriacAustralianAustrianBahamianBangladeshiBarbadianBasqueBelgianBelizeanBermudanBhutaneseBlackfeetBolivianBrazilianBritishBritish West IndianBulgarianBurmeseCajunCambodianCanadianCape VerdeanCarpatho RusynCelticCentral AmericanCentral American IndianCherokeeCheyenneChickasawChileanChineseChippewaChoctawColombianColvilleComancheCosta RicanCreeCreekCroatianCrowCubanCypriotCzechCzechoslovakianDanishDelawareDominicanDutchDutch West IndianEastern EuropeanEcuadorianEgyptianEnglishEstonianEthiopianEuropeanFijianFilipinoFinnishFrenchFrench American IndianFrench CanadianGermanGerman RussianGhanaianGreekGuamanian/ChamorroGuatemalanGuyaneseHaitianHmongHonduranHopiHoumaHungarianIcelanderIndian (Asian)IndonesianInupiatIranianIraqiIrishIroquoisIsraeliItalianJamaicanJapaneseJordanianKenyanKiowaKoreanLaotianLatvianLebaneseLiberianLithuanianLumbeeLuxembourgerMacedonianMalaysianMalteseMarshalleseMenomineeMexicanMexican American IndianMongolianMoroccanNative HawaiianNavajoNepaleseNew ZealanderNicaraguanNigerianNorthern EuropeanNorwegianOkinawanOsageOttawaPaiutePakistaniPalestinianPanamanianParaguayanPennsylvania GermanPeruvianPimaPolishPortuguesePotawatomiPuebloPuerto RicanPuget Sound SalishRomanianRussianSalvadoranSamoanScandinavianScotch-IrishScottishSeminoleSenegaleseSerbianShoshoneSierra LeoneanSiouxSlavicSlovakSloveneSomaliSouth AfricanSouth AmericanSouth American IndianSoviet UnionSpaniardSpanishSpanish AmericanSpanish American IndianSri LankanSubsaharan AfricanSudaneseSwedishSwissSyrianTaiwaneseThaiTlingit-HaidaTohono O'OdhamTonganTrinidadian and TobagonianTsimshianTurkishU.S. Virgin IslanderUgandanUkrainianUruguayanUteVenezuelanVietnameseWelshWest IndianYakamaYaquiYugoslavianYumanYup'ikZimbabwean
Immigration
NonimmigrantsImmigrantsAfghanistanAfricaAlbaniaArgentinaArmeniaAsiaAustraliaAustriaBahamasBarbadosBelarusBelgiumBelizeBoliviaBosnia and HerzegovinaBrazilBulgariaBurma/MyanmarCabo VerdeCambodiaCameroonCanadaCaribbeanCentral AmericaChileChinaColombiaCongoCosta RicaCroatiaCubaCzechoslovakiaDenmarkDominicaDominican RepublicEastern AfricaEastern AsiaEastern EuropeEcuadorEgyptEl SalvadorEnglandEritreaEthiopiaEuropeFijiFranceGermanyGhanaGreeceGrenadaGuatemalaGuyanaHaitiHondurasHong KongHungaryIndiaIndonesiaIranIraqIrelandIsraelItalyJamaicaJapanJordanKazakhstanKenyaKoreaKuwaitLaosLatin AmericaLatviaLebanonLiberiaLithuaniaMalaysiaMexicoMicronesiaMiddle AfricaMoldovaMoroccoNepalNetherlandsNicaraguaNigeriaNorth AmericaNorth MacedoniaNorthern AfricaNorthern EuropeNorwayOceaniaPakistanPanamaPeruPhilippinesPolandPortugalRomaniaRussiaSaudi ArabiaScotlandSenegalSerbiaSierra LeoneSingaporeSomaliaSouth AfricaSouth AmericaSouth Central AsiaSouth Eastern AsiaSouthern EuropeSpainSri LankaSt. Vincent and the GrenadinesSudanSwedenSwitzerlandSyriaTaiwanThailandTrinidad and TobagoTurkeyUgandaUkraineUruguayUzbekistanVenezuelaVietnamWest IndiesWestern AfricaWestern AsiaWestern EuropeYemenZaireZimbabweAzores
In Labor Force | Age 25-29
Income
Poverty
Unemployment
Labor Participation
Family Structure
Vehicle Availability
Education Level
Disability

In Labor Force | Age 25-29 Comparison

Immigrants from Bangladesh

Immigrants from Austria

Tragic
Exceptional
83.0%
IN LABOR FORCE | AGE 25-29
0.0/ 100
METRIC RATING
290th/ 347
METRIC RANK
85.0%
IN LABOR FORCE | AGE 25-29
91.9/ 100
METRIC RATING
108th/ 347
METRIC RANK

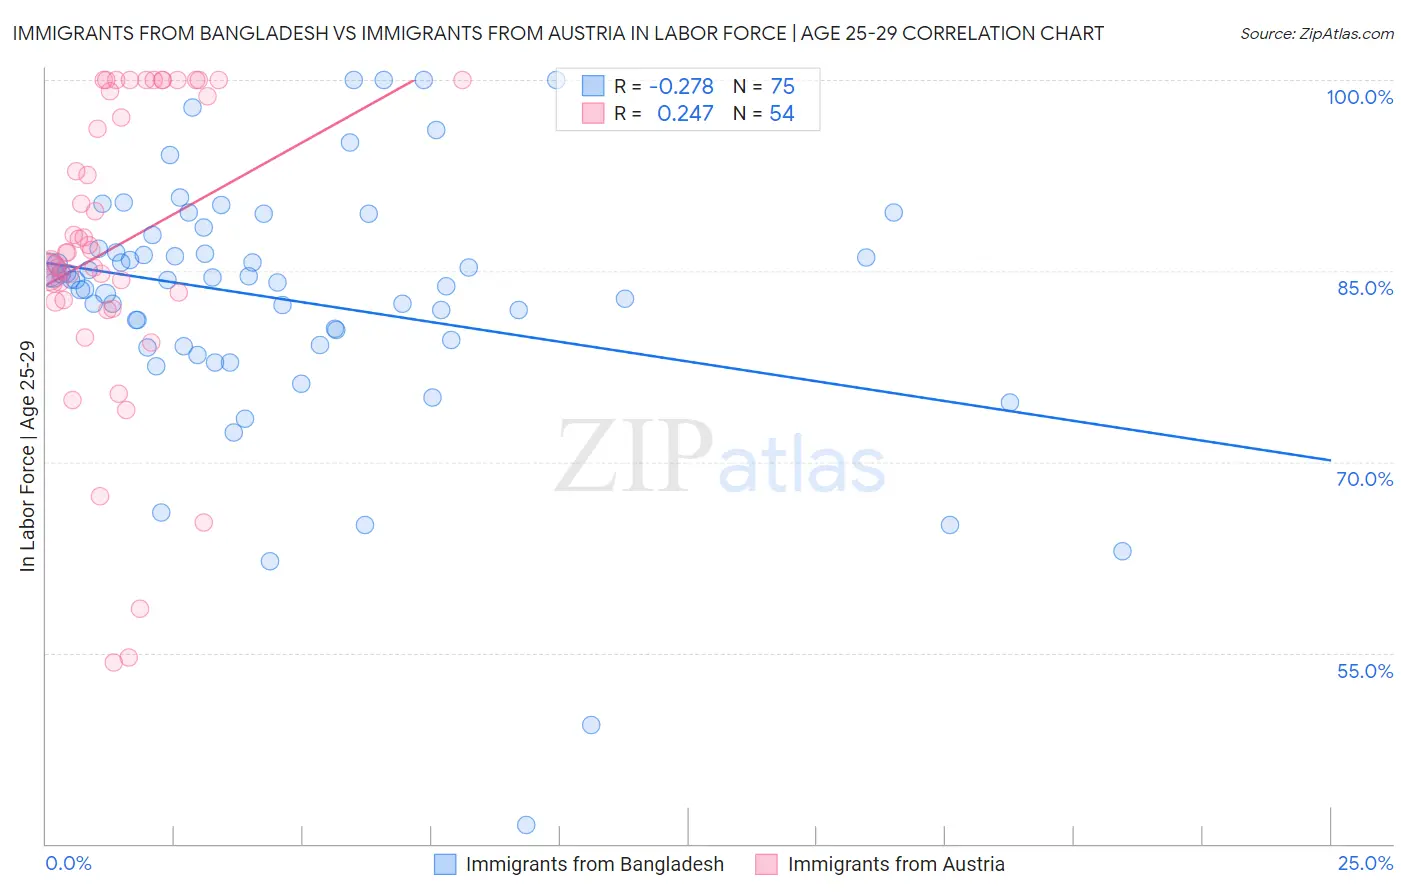
Immigrants from Bangladesh vs Immigrants from Austria In Labor Force | Age 25-29 Correlation Chart

The statistical analysis conducted on geographies consisting of 203,649,040 people shows a weak negative correlation between the proportion of Immigrants from Bangladesh and labor force participation rate among population between the ages 25 and 29 in the United States with a correlation coefficient (R) of -0.278 and weighted average of 83.0%. Similarly, the statistical analysis conducted on geographies consisting of 167,922,363 people shows a weak positive correlation between the proportion of Immigrants from Austria and labor force participation rate among population between the ages 25 and 29 in the United States with a correlation coefficient (R) of 0.247 and weighted average of 85.0%, a difference of 2.5%.
Immigrants from Bangladesh vs Immigrants from Austria In Labor Force | Age 25-29

In Labor Force | Age 25-29 Correlation Summary

MeasurementImmigrants from BangladeshImmigrants from Austria
Minimum41.5%54.2%
Maximum100.0%100.0%
Range58.5%45.8%
Mean82.7%87.0%
Median84.3%86.5%
Interquartile 25% (IQ1)79.2%82.7%
Interquartile 75% (IQ3)86.7%99.2%
Interquartile Range (IQR)7.5%16.4%
Standard Deviation (Sample)10.1%11.7%
Standard Deviation (Population)10.1%11.6%

Similar Demographics by In Labor Force | Age 25-29

Demographics Similar to Immigrants from Bangladesh by In Labor Force | Age 25-29

In terms of in labor force | age 25-29, the demographic groups most similar to Immigrants from Bangladesh are Hawaiian (83.0%, a difference of 0.0%), Immigrants from Guyana (83.0%, a difference of 0.020%), Immigrants from Micronesia (83.0%, a difference of 0.030%), Ottawa (83.0%, a difference of 0.050%), and Immigrants from Latin America (82.9%, a difference of 0.050%).
DemographicsRating | RankIn Labor Force | Age 25-29
Immigrants | Azores
0.0
/100
|
#283
Tragic
83.1%
Nicaraguans
0.0
/100
|
#284
Tragic
83.1%
Belizeans
0.0
/100
|
#285
Tragic
83.1%
Mexican American Indians
0.0
/100
|
#286
Tragic
83.0%
Guyanese
0.0
/100
|
#287
Tragic
83.0%
Ottawa
0.0
/100
|
#288
Tragic
83.0%
Immigrants | Micronesia
0.0
/100
|
#289
Tragic
83.0%
Immigrants | Bangladesh
0.0
/100
|
#290
Tragic
83.0%
Hawaiians
0.0
/100
|
#291
Tragic
83.0%
Immigrants | Guyana
0.0
/100
|
#292
Tragic
83.0%
Immigrants | Latin America
0.0
/100
|
#293
Tragic
82.9%
Nepalese
0.0
/100
|
#294
Tragic
82.9%
Chippewa
0.0
/100
|
#295
Tragic
82.9%
Immigrants | Nicaragua
0.0
/100
|
#296
Tragic
82.9%
Potawatomi
0.0
/100
|
#297
Tragic
82.9%

Demographics Similar to Immigrants from Austria by In Labor Force | Age 25-29

In terms of in labor force | age 25-29, the demographic groups most similar to Immigrants from Austria are Costa Rican (85.0%, a difference of 0.0%), Immigrants from Southern Europe (85.0%, a difference of 0.010%), New Zealander (85.0%, a difference of 0.010%), Immigrants from Middle Africa (85.0%, a difference of 0.010%), and Immigrants from Hong Kong (85.0%, a difference of 0.020%).
DemographicsRating | RankIn Labor Force | Age 25-29
Egyptians
93.8
/100
|
#101
Exceptional
85.1%
Slavs
93.7
/100
|
#102
Exceptional
85.1%
Immigrants | Japan
93.5
/100
|
#103
Exceptional
85.1%
Immigrants | Zaire
93.3
/100
|
#104
Exceptional
85.1%
Immigrants | Hong Kong
92.8
/100
|
#105
Exceptional
85.0%
Czechoslovakians
92.6
/100
|
#106
Exceptional
85.0%
Immigrants | Southern Europe
92.3
/100
|
#107
Exceptional
85.0%
Immigrants | Austria
91.9
/100
|
#108
Exceptional
85.0%
Costa Ricans
91.9
/100
|
#109
Exceptional
85.0%
New Zealanders
91.5
/100
|
#110
Exceptional
85.0%
Immigrants | Middle Africa
91.4
/100
|
#111
Exceptional
85.0%
Senegalese
90.9
/100
|
#112
Exceptional
85.0%
Irish
90.6
/100
|
#113
Exceptional
85.0%
Immigrants | Malaysia
90.4
/100
|
#114
Exceptional
85.0%
South Africans
88.9
/100
|
#115
Excellent
85.0%